


Office Space Demand Forecast, Second Quarter 2021
Release Date: May 2021
Office Space Absorption Projected to Stabilize by Mid-2022
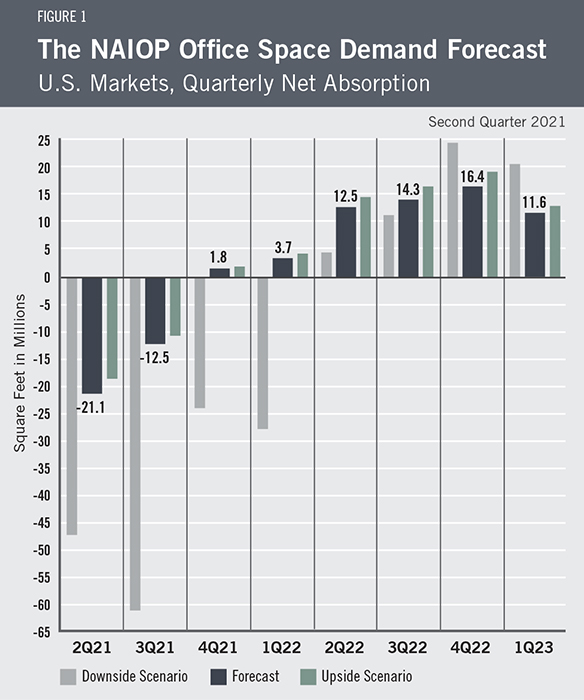 The U.S. economy is experiencing a strong rebound from the COVID-19-induced recession, resulting in job growth in office-using sectors. However, tenant-safety concerns remain a drag on office leasing. The U.S. office market posted continued declines in net absorption in the fourth quarter of 2020 (-26.7 million square feet) and the first quarter of 2021 (-34.8 million square feet). Nonetheless, as coronavirus safety concerns abate and the economy continues to expand, negative net absorption is forecast to moderate over the next two quarters, with a return to positive absorption in the fourth quarter of this year (Figure 1). Quarterly net absorption in 2022 is expected to average 11.7 million square feet, in line with the 2015-2019 quarterly average of 11.6 million square feet.
At the time of this writing, more than half of eligible Americans have received at least one dose of the COVID-19 vaccination, and more than one-third are fully vaccinated. As vaccination rates increase and new coronavirus cases decline, more employers are re-opening their offices. However, a widespread return to the office will likely depend on the return of K-12 schools to in-person instruction. Many schools currently rely on a full- or part-time remote schedule, requiring parents of young children to either stay home or seek alternative childcare arrangements. With vaccination rates on the rise, most schools are now planning to resume full in-person instruction in the fall. As safety concerns about returning to the office recede and schools reopen, office absorption should begin to respond to the current upswing in economic growth.
Several factors are contributing to economic growth, with corresponding employment gains in office-using industries. During the past year, consumers saved money at unprecedented rates, increasing their disposable income. Interest rates remain low, and states continue to lift pandemic restrictions. All signs point to an expansion in the economy with substantial support from an accommodative Federal Reserve and fiscal stimulus. In March, Congress passed a $1.9 trillion coronavirus relief bill that contains an extension of enhanced unemployment benefits, another round of stimulus checks, an increase in child tax credits, aid to state and local governments, and funds to improve the vaccine distribution supply chain and expand the public health workforce. These measures have stimulated consumer spending and alleviated bottlenecks in vaccine production and distribution. Although Congress remains divided on the extent of future infrastructure spending, it currently appears likely that it will pass a significant infrastructure package, which could further contribute to economic growth.
As tenants begin to return to the office, it remains to be seen whether there will be a lasting increase in telecommuting and how that might affect long-term demand for office space. During the pandemic, office tenants were forced to close their offices and ask workers to do their jobs remotely. Surveys showed remote work was successful for many firms, and it has become clear that many now intend to adopt some degree of telecommuting moving forward.1 Some are also considering cohort office work, where groups of workers come into the office on designated days. Increased adoption of remote work arrangements will likely limit net office space absorption over the next several quarters. Due to population and pricing shifts, the authors expect suburban office space to be in relatively greater demand than CBD (central business district) space in the near term.2 Before the pandemic, many firms were trending toward fewer square feet per worker. However, the recent experience with the pandemic may lead tenants to space workers farther apart from each other, partially offsetting declines in demand for office space due to increased telecommuting.
The Forecast
The model that informs this forecast draws from historical data on the economy and office real estate absorption to project future demand. Since global pandemics are very rare, current economic conditions are not easily comparable with most periods for which data are available. Office net absorption unexpectedly took another dip during 2020 Q4 and 2021 Q1. This decline in net absorption during an early stage of economic recovery is different than what followed the last two recessions and is likely due to tenant safety concerns. Drawing from this recent experience, the current forecast projects a later recovery in net office absorption than the previous forecast. Nonetheless, recent trends in office absorption suggest that office-sector performance will continue to reflect economic conditions, as in past economic cycles.
This forecast assumes a continued rebound in real GDP for the remainder of 2021, 2022 and 2023. Real GDP is expected to expand by 7.7% in the next two years, with average unemployment of approximately 4.5%. The forecast also assumes that Personal Consumption Expenditure (PCE) inflation will average 2% in the next two years.
It generally takes several quarters for office net absorption rates to recover from the effects of an economic recession. Given the continued improvements and challenges facing the U.S. economy, the authors have projected three possible scenarios for office net absorption (Figure 1). Across all three scenarios, the office market would return to normal net absorption by the second half of 2022.
The baseline forecast assumes that the recent recession has a limited impact on office net absorption, but it assumes net absorption will be 15% lower than it otherwise would be due to the increasing adoption of remote work arrangements. Growth in net absorption is forecast to resume in Q4 2021. According to the forecast, the quarterly average net absorption will be -16.79 million square feet and 10.04 million square feet, respectively, for the two periods from Q2 2021 to Q3 2021 and Q4 2021 to Q1 2023.
A more optimistic scenario also assumes that the last recession has a limited impact on future office net absorption but does not assume a decrease in absorption due to increased telecommuting. According to this scenario, net absorption would be -18 million square feet in Q2 2021 and -11 million square feet in Q3 2021. Over the period from Q4 2021 to Q1 2023, net absorption would total 71 million square feet with a quarterly average of 11.82 million square feet.
The more pessimistic scenario assumes that the recent recession and the coronavirus pandemic have temporarily impacted how net absorption responds to economic fundamentals, resulting in substantially lower net absorption in the near future. According to this scenario, net absorption would experience substantial fluctuations in the next eight quarters. The quarterly average net absorption would be -54.48 million square feet and 1.33 million square feet, respectively, for the two periods from Q2 2021 to Q3 2021 and Q4 2021 to Q1 2023.
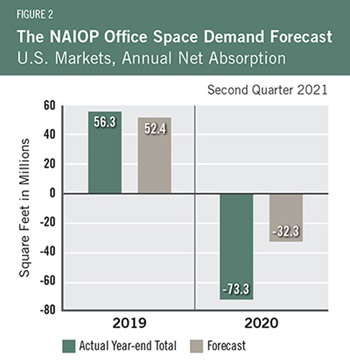
Actual Versus ForecastFigure 2 compares the forecast to actual net absorption. The forecast for 2020 was -32.3 million square feet, which is 41 million square feet more than the -73.3 million square feet that were absorbed for the year. The forecast figure includes data for the first quarter of 2020 that was forecast in the fourth quarter of 2019, prior to the pandemic. The forecast for 2019 was 52.4 million square feet, which is 3.9 million square feet less than the 56.3 million square feet that were absorbed for the year. |
Key Inputs and Disclaimers
In January 2016, the NAIOP Research Foundation published “Forecasting Office Space Demand,” a model that forecasts net absorption of U.S. office space on a quarterly basis for eight consecutive quarters. Created by researchers Hany Guirguis, Ph.D., of Manhattan College, and Joshua Harris, Ph.D., CRE, CAIA, the model is similar to that used for the NAIOP Industrial Space Demand Forecast, which successfully projected a drop and rebound in net absorption of industrial space in 2009 and 2010. (The industrial space demand model was created by Guirguis along with Randy Anderson, Ph.D., then at the University of Central Florida.) Below are the leading, coincident and lagging variables used in the office space demand forecast.
- The growth rate in real gross domestic product (GDP) captures the broadest level of macroeconomic activity, reflecting the value of all goods and services produced each year.
- Corporate profits of domestic industries directly captures the financial capacity and growth of firms that may need to expand. Profits are a source of retained earnings, so they provide a clue about how much money is available to fund investments in plants and equipment, an investment activity that raises productive capacity.
- Total employment in the financial services sector is a direct measure and proxy for office-using employment that best fits with changes in office space demand.
- Two variables from the Institute for Supply Management’s Non-Manufacturing Indices serve as proxies for a sentiment measure on the future health of office-using firms. The ISM-NM Inventories Index measures increases and decreases in inventory levels, while the ISM-NM Supplier Deliveries Index measures how long it takes suppliers to deliver parts and materials that are integral to service-sector businesses.
- Core Personal Consumption Inflation Rate (PCE Inflation).
These five measures make possible an accurate two-year forecast of net absorption of office space nationwide. The methods used in the forecast are dynamic rather than static, to account for the changing nature of the underlying macro economy.
Office absorption data are provided by CBRE Econometric Advisors, which assumes no responsibility for this forecast. The absorption forecast tracks with CBRE office data and may vary when compared to other datasets. Data include office buildings in the U.S. with a minimum rentable building area that ranges from 10,000 to 150,000 square feet, depending on the market. The current forecast is based on first quarter 2021 data.
Authors
Professor Hany Guirguis, Ph.D., O’Malley School of Business, Manhattan College Professor
Michael J. Seiler, DBA, William & Mary and the University of Cambridge
Media Inquiries
Please contact Kathryn Hamilton, CAE, vice president for marketing and communications, at hamilton@naiop.org.
1 Notable firms planning a return to the office include Goldman Sachs, Amazon, Apple, Ernst & Young, and Facebook, while Ford, Twitter, and Salesforce are leaning towards continued use of remote work arrangements.
2 Wyatt Avery, “US Prices for CBD, Suburban Offices Chart Different Paths,” Real Capital Analytics, April 22, 2021, https://www.rcanalytics.com/us-prices-march-2021-rcacppi/.
