


Examining Development Approvals Across North America: An Analysis of Site Plan and Building Permit Review Processes
Release Date: June 2023
Overview
In February 2021, the NAIOP Research Foundation released The Development Approvals Index: A New Tool to Evaluate Local Approvals Processes (the Index). The Index provides a systematic method to evaluate and compare approvals processes in different jurisdictions objectively (e.g., without the use of opinion surveys or based on the experiences of a particular individual). To achieve this, the Index focuses on site and building plan reviews, permitting and inspections. A user can enter publicly available data on these elements into the Index and compare them across several key metrics, which are weighted and summarized under three broad “pillar” categories: transparency, accountability and consistency—all of which affect the duration and cost of approvals, and the risk that a project goes uncompleted.
The “Transparency” pillar focuses on elements of the approvals process, such as plan and permit tracking systems, fee calculators and process guides, that provide developers with clarity regarding the approvals process, as well as the cost and status of submissions. The “Accountability” pillar measures a jurisdiction’s commitment to completing its approvals process in a timely manner, either by its own staffing or by offering developers alternative options, such as third-party review. The “Consistency” pillar measures factors that affect the predictability of a jurisdiction’s timing and consistency in feedback for planning review, permitting and site inspections.1
Note that the Index does not examine jurisdictional processes or approvals related to zoning; its scope is limited to site plan and building approvals. The Index focuses on an objective evaluation of approvals processes but is not a direct benchmark of average approval timelines or costs. As such, it is recommended that developers interested in a specific jurisdiction conduct additional research to evaluate the procedures, timelines and fees associated with a potential project. While the Index uses a score and ranking methodology to evaluate the relative strengths and weaknesses of approvals processes in different jurisdictions, it should not be considered an endorsement of any individual jurisdiction’s overall approvals process. Notably, most jurisdictions did not achieve high overall scores. Even the highest-scoring jurisdiction of Fairfax County, Virginia, scored only 69 out of a possible 120 points. To encourage best practices, some of the jurisdictions that have adopted specific exemplary practices are discussed at the end of this brief.
Expansion and Refinement
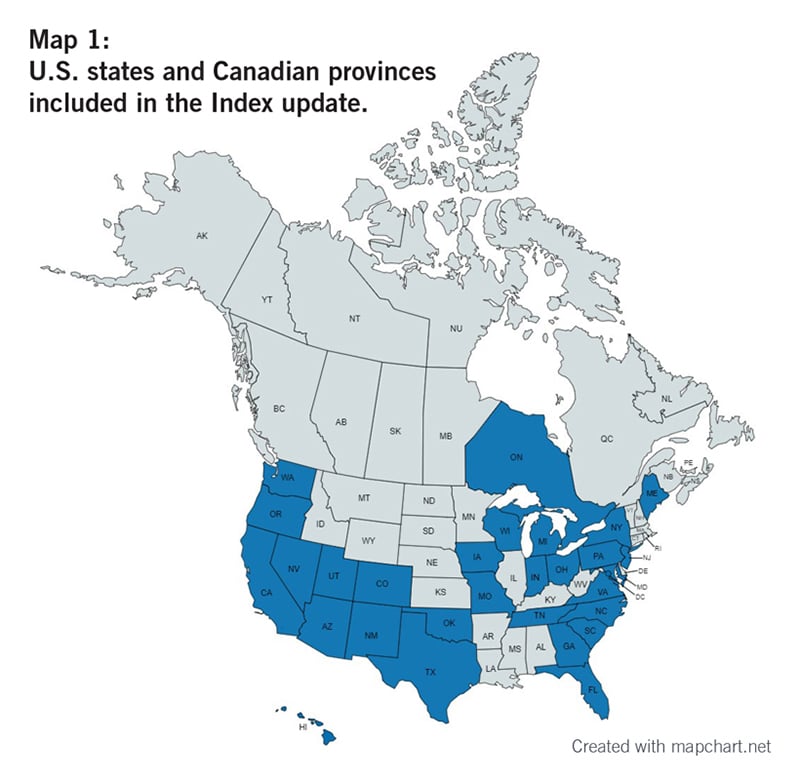
Initially, the Index was populated with 30 jurisdictions from 16 U.S. states and was accompanied by a research brief providing a detailed example of how the Index could be used by different stakeholders.2 During summer and fall 2022, the NAIOP Research Foundation and George Mason University expanded the data collection to include jurisdictions representing additional NAIOP chapters. The updated Index now includes 100 jurisdictions from 30 U.S. states and the Canadian province of Ontario, with improved geographical representation from the Central and Pacific regions, as shown in Map 1. A spreadsheet that accompanies this brief contains detailed data on each of these jurisdictions’ processes.
As part of this latest update, the Index’s data-collection instrument and scoring system were refined to include site plan review processes and to account for a greater range of approaches to review processes across an expanded number of jurisdictions. For example, a new prompt was created to reflect the possibility of concurrent site and building plan submission in some jurisdictions. Another change accounts for approvals completed by a single department that might be tasked with the entire review process.
Analysis
The more robust data set from this update allows for analysis across a range of factors. Results were examined through a comparison of the 10 highest-scoring and 10 lowest-scoring jurisdictions, as well as a broader comparison of the top 30 percent and bottom 30 percent. The following discussion summarizes the findings from these comparisons.
Note that the data used in this brief is a snapshot of the approvals processes during the collection period; jurisdictional processes or publicly available information may have changed since that time.3 Further, jurisdictions whose processes are opaque may be penalized across one or more measures because not enough information about their operations is publicly available.
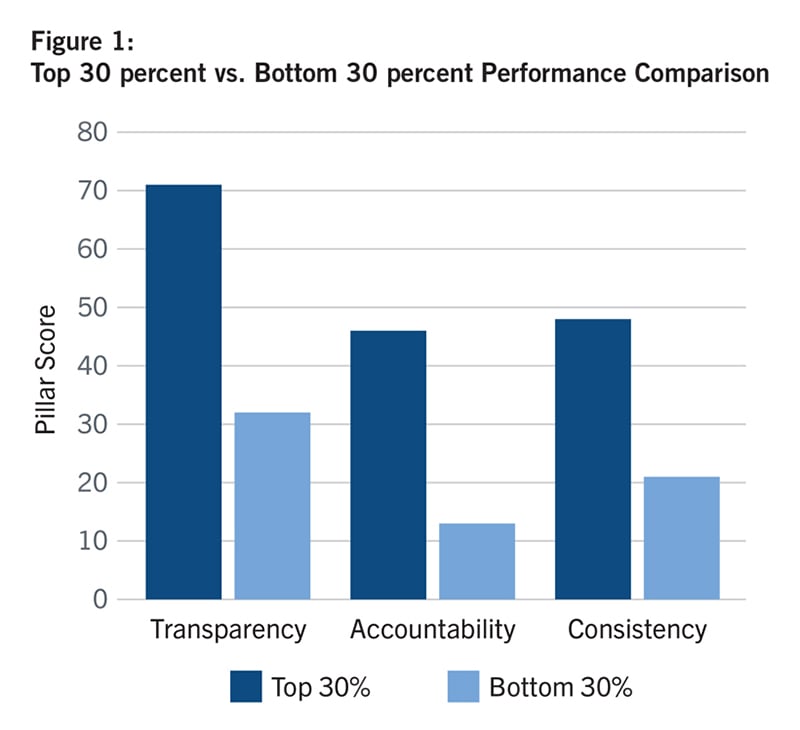
Both the highest- and lowest-ranked jurisdictions share the Transparency pillar as their strongest metric, although their respective scores are noticeably different: the top 30 percent of jurisdictions score an average of 70 points while the bottom 30 percent score only 32 points on average (out of a total 120 points possible). A summary of these scores is shown in Figure 1; the comparison of the first 10 vs. last 10 jurisdictions reflects the same relative score pattern for all three pillars. No single jurisdiction holds the highest rank across all three pillars.
The largest relative difference between the highest and lowest 30 percent of jurisdictions appears in the Accountability scores, which measure a jurisdiction’s commitment to responsibility for its handling of applications and inspections. The metrics in this pillar tend to require more innovative procedural reforms in order for a jurisdiction to score well, such as the creation of third-party review and inspection programs, expedited review, data tracking, and performance measurement. The highest-scoring 30 percent have, at some point, undertaken some of these reforms.
However, there is noticeable room for improvement for all jurisdictions regardless of their rank. The updated Index results spreadsheet features a summary “Points Capture Rate” column showing the percentage of total possible points achieved by each jurisdiction. Capture rates for the first 10 jurisdictions range from 46 percent to 58 percent, indicating that even the highest-scoring jurisdictions are only capturing a portion of the total possible points. While it is relatively easy for jurisdictions to earn points in the Transparency pillar by keeping websites updated and clear, focusing on procedural improvements that are reflected in Accountability and Consistency measures may be more meaningful for improving approval outcomes.
Demographics
One hypothesis considered in earlier research for the Index was that more populous and urbanized jurisdictions would have improved approval processes to meet their greater needs; however, the results do not seem to support this interpretation.
The average population of the 10 highest-scoring jurisdictions is nearly five times larger than the average population of the lowest 10 jurisdictions. Four of the 10 leading jurisdictions have populations of over 1 million and six have populations over 500,000. In contrast, there is only one jurisdiction in the lowest 10 with a population over 500,000. An expanded focus to include the population of the top 30 percent versus the bottom 30 percent of jurisdictions shows similar results, with the top being more than 2.5 times more populous on the whole. This would suggest that more populous jurisdictions generally score higher, although this hypothesis is inconclusive. There appears to be a relevant correlation between population and performance on both the Transparency and Accountability pillars for the 10 highest-scoring jurisdictions, while there is a modest correlation between population and performance on both the Accountability and Consistency pillars for the 10 lowest-scoring jurisdictions. Within the top and bottom 30 percent of jurisdictions collectively, the Accountability pillar continues to show a modest connection to population. However, regression analyses of the scores for all 100 jurisdictions showed no clear correlation between population and overall score, rank or performance on an individual pillar.
Despite having larger populations, the 10 leading jurisdictions are far less dense than the 10 lowest-scoring jurisdictions. The level of urbanization, as measured by population density, of the 10 lowest-scoring jurisdictions shows they are more than 2.5 times denser than the first 10. This ratio is largely unchanged (2.2 times denser) even when outliers are excluded. In summary, the bottom 10 jurisdictions are characterized by small relative populations, as well as a smaller relative amount of space available for development. Note that the underlying metric is population per square mile, which does not reveal the distribution of development across the jurisdiction’s land area, so some areas may be denser than others even within a jurisdiction. Interestingly, the relative densities of the top and bottom 30 percent of jurisdictions are nearly equal, suggesting that the impact of this variable may be more pronounced for the best and worst performers. There is no clear correlation between population density and the performance of the first and last 10 jurisdictions. In the absence of a consistent correlation between population or population density and score, urbanization alone may be a poor predictor of the transparency, accountability and consistency of municipal approvals processes.
The average median household income is 26 percent higher for the 10 highest-scoring jurisdictions than for the 10 lowest-scoring, and 12.9 percent higher for the top 30 percent than for the bottom 30 percent. Jurisdictions with higher household incomes might be expected to perform better on the Index because of higher assumed property tax collections and associated budgetary resources, but an analysis of the results suggests this is not the case. While there is a modest correlation between median household income and Consistency scores for the bottom 30 percent of jurisdictions, there is no clear overall trend with respect to income and pillar scores, and no clear correlation between median household income and total overall score when all 100 jurisdictions are compared. With respect to total per capita budgetary expenditures, the average outlay is $5,008 per person in the 10 highest-scoring jurisdictions compared to $2,849 for the 10 lowest-scoring jurisdictions; however, there is no clear correlation between per capita spending and performance.
Despite some observed differences between highest- and lowest-ranked jurisdictions, regression analysis showed no obvious, significant relationship between population or income variables and Index scores. It is likely that other unobserved or difficult-to-measure combinations of variables affect a jurisdiction’s performance, or that demographic and socioeconomic variables interact in a way that is difficult to evaluate with a regression analysis. However, the apparent absence of a clear relationship between population, density or household income and a jurisdiction’s performance in the Index suggests that embracing best practices for development approvals may not be dependent on a jurisdiction having particular demographic characteristics. Further study would be needed to determine if other variables, such as leadership, governance structure, growth rates, tax revenues, educational attainment and available resources (human and financial) are possible explanatory factors.
Exemplars
Examples of best practices from the highest-scoring jurisdictions can be useful for those looking to improve their local processes. The following exemplary jurisdictions received comparatively high scores for Transparency, Accountability and Consistency.
Transparency – Goodyear, Arizona
Not only does Goodyear meet basic measures of transparency by having current and clear development approvals instructions,4 the jurisdiction also maintains an online system for submitting site plans, building permit applications and site inspection requests that offers users a detailed description of an application’s status at each stage of the review process. Goodyear’s submission process also includes an initial review of applications for deficiency/completeness before staff conducts a full review. Further, the time to review minor resubmissions or deficiency cures is shorter than the original review period. Collectively, these procedures allow applicants to have a clear understanding of the application process and the status of submitted applications, and reduce delays associated with incomplete submissions.
Accountability – Fairfax County, Virginia
In Fairfax County, an applicant has the option to elect an expedited review, peer/third-party design review or third-party inspections for a project. These options allow the jurisdiction to continue moving approvals forward (at the developer’s discretion), even if internal capacity isn’t available to complete the necessary reviews in a timely manner. Fairfax County also publishes staffing information, data on the number of building permits and inspections requested and those approved and completed, and data on performance metrics such as the average number of days to process site plan and building permit applications or to complete building inspections. While this information is related to transparency, publishing these types of metrics demonstrates a jurisdiction’s willingness to be publicly accountable for its results to various stakeholders.
Consistency – Georgetown, Texas
The “Consistency” pillar measures factors that affect the predictability of a jurisdiction’s timing and consistency in feedback for site plan review, permitting and site inspections. To earn a comparatively high Consistency score, Georgetown has enacted processes that provide developers with a higher level of certainty regarding application outcomes. Examples include limiting the maximum amount of time needed to complete a full review of site plans and building plans to under 90 days, and having a dedicated case manager assigned to each review to limit conflicting feedback. These types of measures help protect developers from incurring significant and unexpected increases in project timelines and costs as they try to reconcile potentially conflicting requirements from different departments or at different stages of the review process.
Note that while Georgetown should be credited for employing these best practices, Texas House Bill 3167,5 often referred to as the “shot clock” bill, requires municipalities to approve or deny site plan applications within 30 days of their submission. While some jurisdictions have sought to institute waivers to bypass shot-clock regulations, it is often unclear whether these waivers contribute to better or worse outcomes. It is also unclear whether the waivers are motivated by a desire to improve the review process for applicants or by a lack of sufficient staff to meet the timeframes required by the law. Jurisdictions seeking to adopt best practices for improving Consistency do not need an underlying law to streamline application processes.
Conclusion
The most recent updates to the Development Approvals Index offer expanded coverage and greater detail, which developers and their stakeholders can use to evaluate site-plan and building-approval processes in local jurisdictions. The data collected using the Index suggest that there is room for improvement even among highest-scoring jurisdictions. While jurisdictions may find it challenging to enhance certain aspects of approvals processes, for example by increasing staffing levels to achieve shorter approval timelines, many of the metrics measured by the Index do not require large investments of municipal resources. Index results can help facilitate discussions with municipalities around adopting best practices that are achievable even in a resource-constrained environment.
About NAIOP
NAIOP, the Commercial Real Estate Development Association, is the leading organization for developers, owners and related professionals in office, industrial, retail and mixed-use real estate. NAIOP comprises some 20,000 members in North America. NAIOP advances responsible commercial real estate development and advocates for effective public policy. For more information, visit naiop.org.
The NAIOP Research Foundation was established in 2000 as a 501(c)(3) organization to support the work of individuals and organizations engaged in real estate development, investment and operations. The Foundation’s core purpose is to provide information about how real properties, especially office, industrial and mixed-use properties, impact and benefit communities throughout North America. The initial funding for the Research Foundation was underwritten by NAIOP and its Founding Governors with an endowment established to support future research. For more information, visit naiop.org/research-foundation.
About the Author
C. Kat Grimsley, Ph.D. is a visiting scholar in the Housing Economics and Real Estate Sector Research Group at the University of Alicante in Spain. She supports the commercial real estate industry in both the U.S. and Europe through outreach, special research projects, and advisory roles. Dr. Grimsley was recently appointed as an advisory peer to the U.S. Department of State’s Bureau of Overseas Buildings Operations as part of their Industry Advisory Group. She is also vice-chair of the United Nations Economic Commission for Europe’s Real Estate Markets Advisory Group under the Committee of Urban Development, Housing, and Land Management. She served as the first Thomas J. Bisacquino NAIOP Distinguished Fellow while director of the MRED program at George Mason University. Dr. Grimsley holds a BS in Finance (hons; specialization in real estate investment analysis) from the University of Illinois at Urbana-Champaign, an MS in Real Estate from Johns Hopkins University and a PhD in Land Economics from the University of Cambridge in England.
Media Inquiries
Please contact Kathryn Hamilton, vice president for marketing and communications, at hamilton@naiop.org.
Disclaimer
This project is intended to provide information and insights to industry practitioners and does not constitute advice or recommendations. NAIOP disclaims any liability for actions taken as a result of this project and its findings.
© 2023 NAIOP Research Foundation
Endnotes
1 The Development Approvals Index: A New Tool to Evaluate Local Approval Processes provides additional information on how the Index is constructed and weighted.
2 Findings from the Development Approvals Index, published by the NAIOP Research Foundation in April 2022, provides a detailed example of how the Index can be used.
3 An accompanying spreadsheet contains the data collected for individual jurisdictions and was current as of the fall of 2022. If you believe that answers to individual questions in the spreadsheet were incorrect at the time of this brief’s publication, please contact NAIOP’s research director, Shawn Moura at moura@naiop.org.
4 An outline of Development Services’ processes for building plan review and permitting can be found in the City of Goodyear Administrative Process Manual (APM), https://www.goodyearaz.gov/home/showpublisheddocument/23502/636881503133130000.
5 Relating to County and Municipal Approval Procedure for Land Development Applications, Texas H.B. 3167, 86th Legislative Session (2019), https://capitol.texas.gov/BillLookup/History.aspx?LegSess=86R&Bill=HB3167.
