


Findings from the Development Approvals Index
Release Date: April 2022
Overview
In February 2021, the NAIOP Research Foundation released The Development Approvals Index: A New Tool to Evaluate Local Approvals Processes (the Index). The Index provides a systematic method to evaluate and compare approvals processes in different jurisdictions objectively (e.g., without the use of opinion surveys or based on the experiences of a particular individual). To achieve this, the Index focuses on building plan reviews, permitting and inspections. Publicly available data on these elements can be entered into the Index by a user and compared across several key metrics in these areas, which are weighted and summarized under three broad “pillar” categories: transparency, accountability and consistency—all of which affect the duration and cost of approvals.
The “transparency” pillar focuses on elements of the approvals process, such as plan and permit tracking systems, that provide developers with clarity regarding the approvals process, cost and status of submissions. The “accountability” pillar measures jurisdictional commitment to completing its approvals process in a timely manner, either by its own staffing or by offering developers alternative options, such as the option for third-party review. The “consistency” pillar measures the degree to which a jurisdiction’s timing and feedback for planning review and permitting are predictable.1
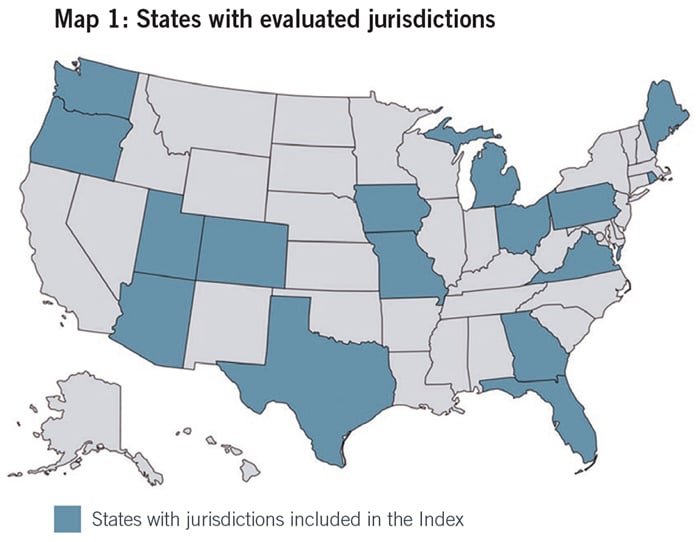
With the help of several NAIOP chapters and George Mason University, the Index has been populated with an initial round of data collected from August 2021 to March 2022 that includes 30 jurisdictions in 16 states with representation from the Atlantic, Central, Mountain and Pacific regions.2 Participating NAIOP chapters identified jurisdictions of interest, and these were supplemented with data from jurisdictions that are not served by a NAIOP chapter to add geographic diversity to the results. While these results are preliminary, they provide an enticing first look at the comparative applications of the Index. This brief will provide an overview of these initial results and outline examples of how the resulting information may be useful to both developers and jurisdictions.
It should be noted that the results are based on a cross section of data (i.e., what was publicly available at the time of collection). This data will be expanded upon and updated in the future.
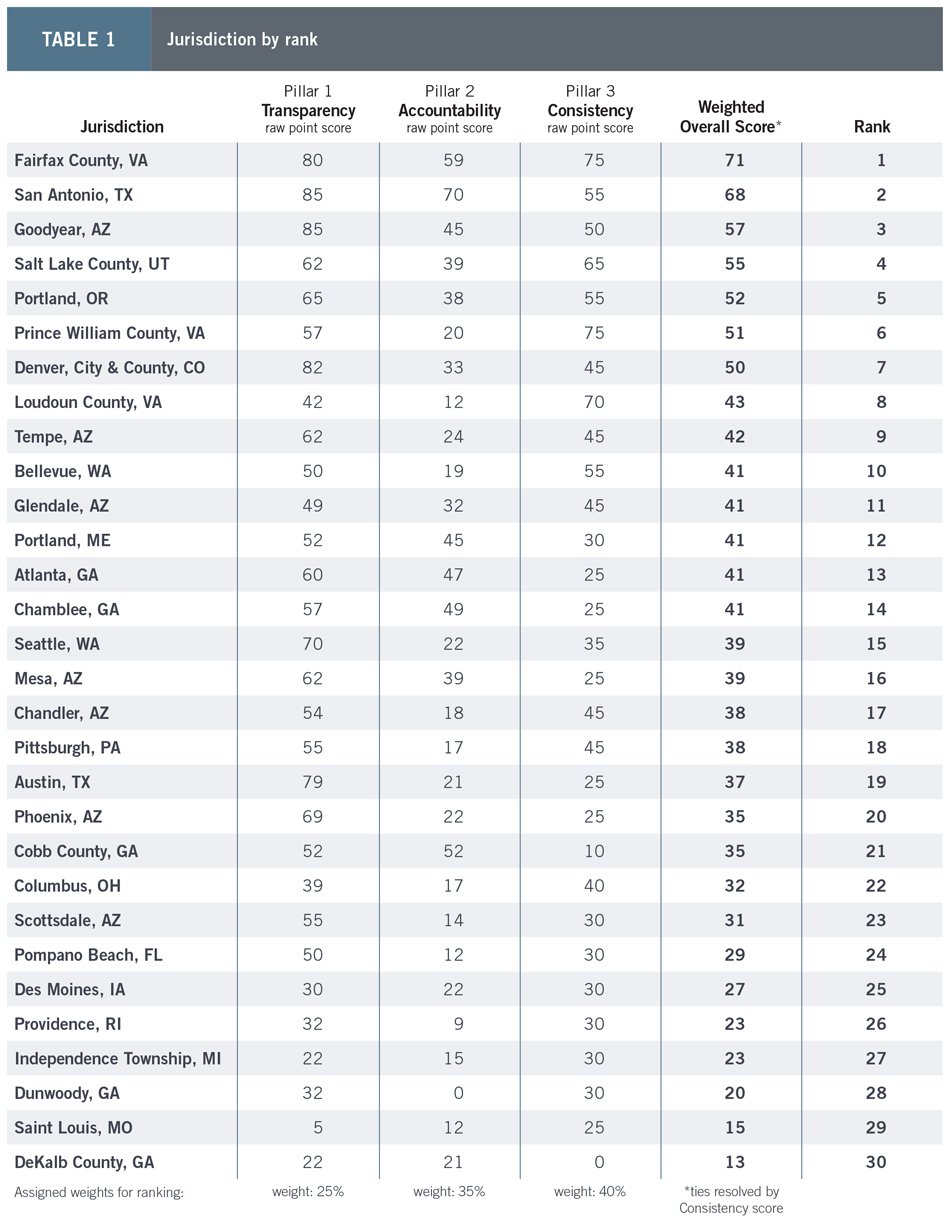
Map 1 provides a visual representation of states with jurisdictions included in the Index, while Table 1 shows the 30 jurisdictions ranked by their Index results. Details of the underlying evaluation metrics can be reviewed by accessing the full Index spreadsheet here.
Applications
There are several useful applications of the Index results, even at this early stage of collection. Indeed, the Index aims to inspire the evolution of approvals processes in several ways. For example, jurisdictions can use Index results as an objective benchmark to track improvements to their processes. Several examples of best practices were discussed in a December 2021 NAIOP Market Share blog post. The Index also empowers developers, economic development authorities and other groups to advocate for best practices in their local jurisdictions. Finally, the Index is an industry resource that measures and quickly compares jurisdictions’ review processes across key metrics. Among other uses, this allows developers to make more fully informed decisions about expanding into new markets.
Example 1: Comparing National Markets for a Proposed Industrial Project
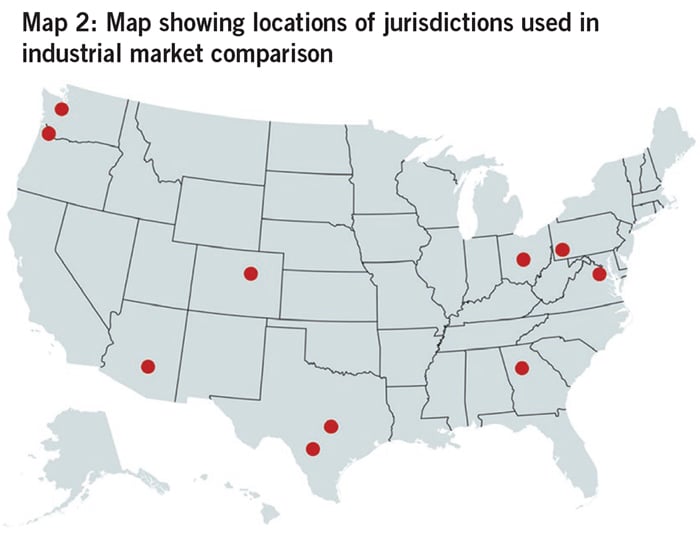
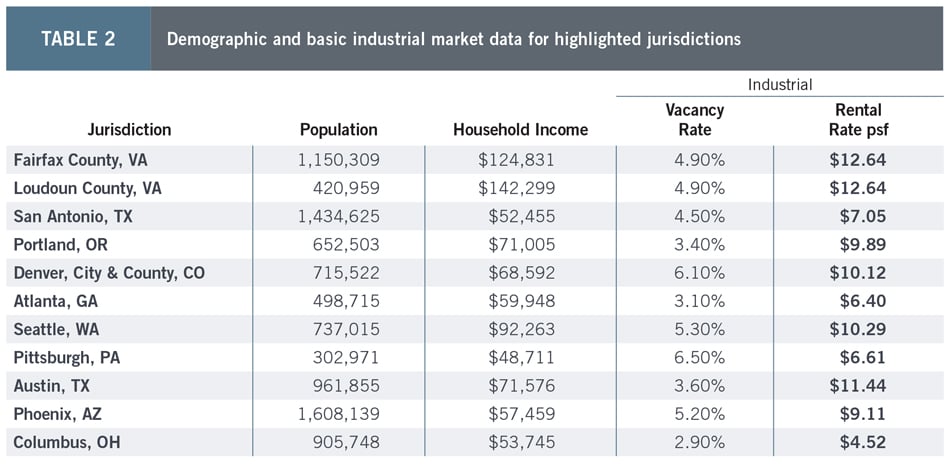
A broad review of results offers an example of how the Index can provide a snapshot comparison of different jurisdictions to support data-driven decision-making for developers evaluating opportunities to expand into new markets. This exercise can be undertaken for any product type, but the example below contemplates comparing large markets for a new industrial project, as shown in Map 2. Table 2 offers a preliminary evaluation of these jurisdictions using demographics and basic industrial market data.3
While basic data categories such as these can help developers evaluate a project’s feasibility, they do not convey the relative strengths—and weaknesses—of each jurisdiction in the implementation of their building plan review, permitting and inspections processes. Applying for these approvals often requires a substantial investment of time, effort and money, and can introduce significant project risks. Fees, delays in the approvals process and required design changes can all increase project cost, reduce return on investment or even obligate a developer to unexpectedly reconsider their plans. Rather than accept unknowns in these areas when expanding into a new jurisdiction, the Index allows developers to add measures of jurisdictional performance to their overall evaluation of new markets, as shown in Table 3.
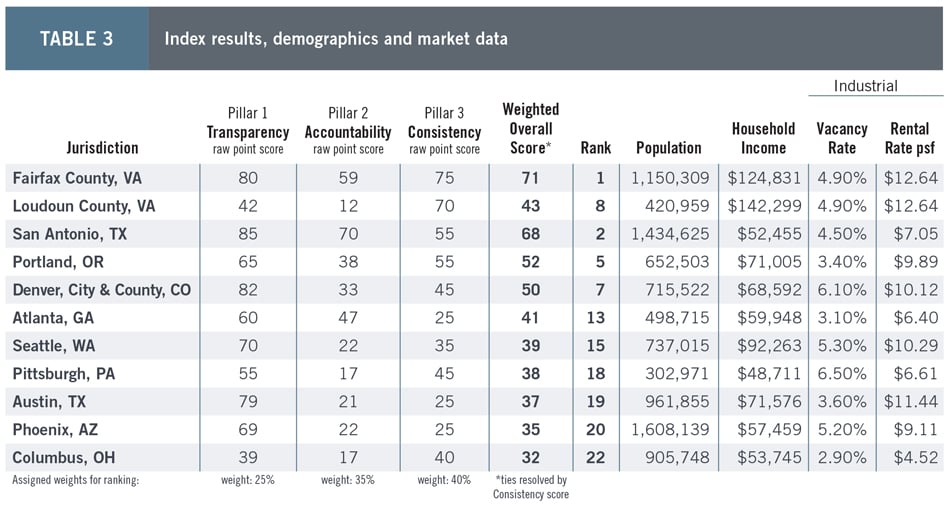
While there are several different comparisons that can be made, consider San Antonio, Texas, and Phoenix, Arizona. Both have close to the same number of residents, income levels, vacancy rates and asking rates, but the two jurisdictions perform very differently in the Index: San Antonio ranks at No. 2 while Phoenix ranks No. 20. While the Phoenix industrial market (about 8.6 million square feet of net absorption) is significantly larger than the San Antonio market, (about 1.4 million square feet of net absorption), San Antonio’s industrial market has experienced steady growth with continued demand over the past three years.4
With respect to Index results, San Antonio performs well across all three pillars of transparency, accountability and consistency, all of which can significantly improve developers’ ability to predict the duration and cost of the approvals process. Examples of differences between these two jurisdictions on some of the specific underlying metrics are described below; note that this is not an exhaustive review.
Transparency Measures
Both jurisdictions are among the top 10 performers for transparency in the Index; however, there are instances where San Antonio’s process offers greater clarity. For example, the approvals processes of both jurisdictions include a deficiency review, which is laudable, but San Antonio commits to complete the review within five days, while there is no specified time frame in Phoenix. Indeed, San Antonio provides a detailed outline of the review process, including specifics about response time frames and concurrent reviews, all of which makes it easier for a developer to predict the time needed to complete the process in San Antonio.
Accountability Measures
Allowing a range of review options helps jurisdictions remain accountable for processing approvals within a reasonable (or prescribed) time frame, even when a jurisdiction may be short staffed or facing an influx of submissions. Both San Antonio and Phoenix allow developers to request an expedited review, but San Antonio offers additional options, such as third-party inspections. Unlike Phoenix, San Antonio also publishes metrics on the number of building permits that it processes and inspections that it completes. The publication of this information provides developers with confidence that there is an active effort to complete and approve reviews in a timely manner.
Consistency Measures
San Antonio’s approval process offers published time frames for various steps in the process and includes a cross-cutting method to ensure that reviews from separate departments are coordinated. These measures help protect developers from incurring significant and unexpected increases in project timelines and costs as they try to reconcile conflicting feedback from different departments or at different stages of the review process. Phoenix’s process does not include either of these measures.
Example 2: Comparing Submarkets
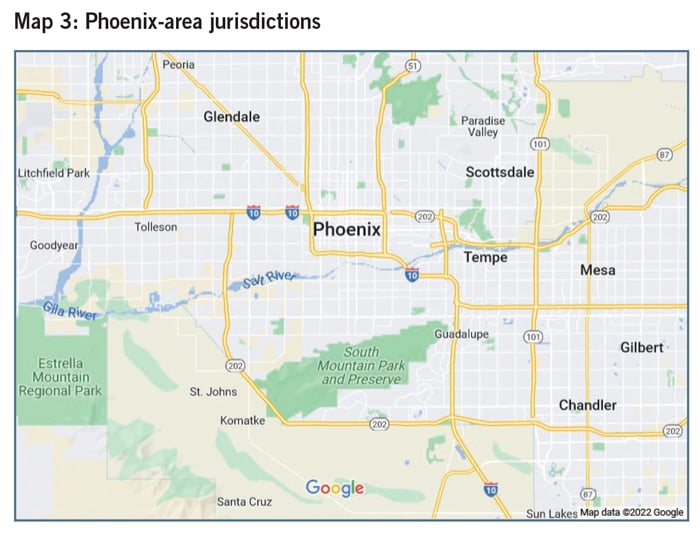
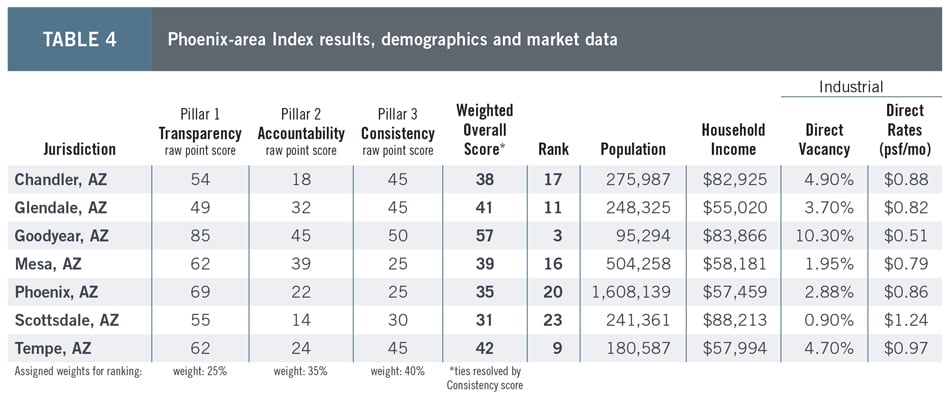
The Index can be a powerful tool for comparing submarket opportunities. For example, if a developer were attracted to the strong fundamentals for industrial development in the Phoenix metropolitan area, they could undertake the same exercise to compare local jurisdictions. Indeed, Index data for the Phoenix-area submarkets reveal a range of results. Map 3 shows the relative locations and major highway access for the Phoenix-area jurisdictions included in the Index, and Table 4 shows how jurisdictions scored according to the Index, alongside demographic and basic industrial market data.5
Analysis of the Full Results
The Index rankings are useful as a stand-alone measure of performance, but analysis of possible correlations or causalities may be helpful in explaining results. To that end, this section summarizes an initial evaluation of whether demographic and economic factors and jurisdictional structure may have affected Index results.
Index results as compared to jurisdictional population and household income suggest no especially interesting relationship. For example, the No. 1-ranked jurisdiction (Fairfax County, Virginia) has both a large population and high household income, while the No. 2 jurisdiction (San Antonio, Texas) has a large population but low household income. Conversely, the No. 3 jurisdiction (Goodyear, Arizona) has a relatively small population but high household income. As a broad observation, the majority of the top 10 performing jurisdictions coincided with the upper half of both jurisdictional population and income measures. Perhaps unsurprisingly, eight of the top 10 performers coincided with the upper half of household earnings, suggesting a possible connection between constituent household income and jurisdictional performance. However, there are several interrelated factors with possible explanatory value related to this observation, such as the amount of developable land available, property values, taxes and resulting jurisdictional budgets; and the expectations and behavioral patterns of citizens in these jurisdictions, which may reflect their earnings and educational attainment.
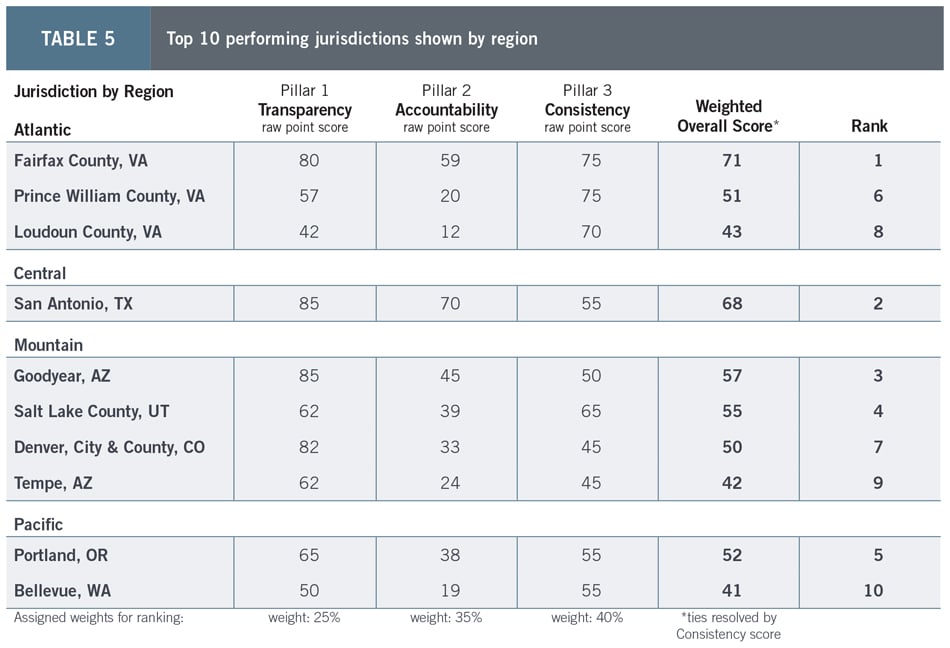
Regionally, the top five performing jurisdictions are distributed relatively evenly across all regions with one top performer each in the Atlantic, Central and Pacific regions, and two top performers in the Mountain region. However, when expanded to include the top 10 performers, the Mountain and Atlantic regions appear to outperform other parts of the country, with four and three of the top 10 jurisdictions respectively, as shown in Table 5. It is worth noting that the Atlantic region includes 12 jurisdictions with representation in the Index, yet all three of the top 10 performing jurisdictions in the Atlantic region come from the same state: Virginia. Indeed, there is an uneven representation of jurisdictions from each region; therefore, a more useful measure is the percentage of high-performing jurisdictions relative to the total number of jurisdictions included from each region (which does not diminish the observation about Virginia). In this case, the West Coast outperforms the other regions with 67% of the Pacific jurisdictions being included in the top 10 performers, compared to 44% for the Mountain region, 25% for the Atlantic and 17% for the Central region. Note also that there are several ways to geographically divide the nation, and results are influenced by choice of regional allocation.
Both cities and counties were included in the preliminary Index results, which obligates a review of any potential differences based on jurisdictional structure. Despite the Index including three times more cities than counties, the top-five-performing jurisdictions are effectively split, with two located in counties and three located in cities. Expressed as a percentage, only 13% of the cities measured were among the top five performers vs. 29% of counties. When expanded to include the top 10 performers, half are in counties and half in cities. Given the (approximately) 1:3 ratio of counties to cities, however, this distribution still indicates a significantly stronger overall performance by counties. This observation is certainly interesting and warrants further analysis to determine if it has any explanatory value or is a result of the particular jurisdictions included in the initial results. It should be noted that Denver has a joint city-county jurisdictional structure and is included with counties; this allocation does not materially change the resulting observations discussed in this section.
Next Steps
Since its launch in early 2021, the Index has undergone a series of refinements and a first round of data collection. The initial results demonstrate the value of the Index in comparing jurisdictions and supporting data-driven decisions. In order to fully recognize the benefits of the Index, however, there are several next steps that can help to further refine results. For example, several observations from the data-collection process will be evaluated to adjust and clarify the spreadsheet for collecting information about jurisdictions. The inclusion of more jurisdictions is also needed to have a robust data set for trend analysis. In particular, the Index would benefit from increased jurisdictional representation from primary and secondary metropolitan areas (both cities and peri-urban counties) as well as from additional Central and Pacific jurisdictions. Tracking jurisdictional budgets would also provide potentially useful data to compare against jurisdictional structure for further analysis of the apparent discrepancy in city-county representation in top 10-performing jurisdictions. After further data collection, the analysis of results could also be expanded to include regression and/or cluster analysis to further explore any possible explanatory factors for Index results. To this end, the NAIOP Research Foundation will continue to develop the Development Approvals Index throughout the summer and fall of 2022.
About NAIOP
NAIOP, the Commercial Real Estate Development Association, is the leading organization for developers, owners and related professionals in office, industrial, retail and mixed-use real estate. NAIOP comprises some 20,000 members in North America. NAIOP advances responsible commercial real estate development and advocates for effective public policy. For more information, visit naiop.org.
The NAIOP Research Foundation was established in 2000 as a 501(c)(3) organization to support the work of individuals and organizations engaged in real estate development, investment and operations. The Foundation’s core purpose is to provide information about how real properties, especially office, industrial and mixed-use properties, impact and benefit communities throughout North America. The initial funding for the Research Foundation was underwritten by NAIOP and its Founding Governors with an endowment established to support future research. For more information, visit naiop.org/researchfoundation.
About the Author
Kat Grimsley is a NAIOP Distinguished Fellow and the Director of the Master of Science in Real Estate Development (MRED) program at George Mason University in Fairfax, Virginia. She is responsible for all aspects of the program including faculty, staff, student and curriculum management. Dr. Grimsley also supports the commercial real estate industry through outreach and special research projects as Associate Director of the Center for Real Estate Entrepreneurship (CREE). Currently, she also serves as an advisory board member and vice-chair of the United Nations Economic Commission for Europe’s Real Estate Markets Advisory Group under the Committee of Urban Development, Housing and Land Management.
Prior to joining George Mason University, Dr. Grimsley managed an international property development portfolio for the U.S. Department of State, where she devised acquisition strategies for diplomatic properties in more than 25 countries and represented the U.S. government in the implementation of each. Dr. Grimsley also has private-sector experience conducting market research, financial modeling and site analysis for local and national client portfolios. Dr. Grimsley holds a BS in Finance (hons; specialization in real estate analysis) from the University of Illinois at Urbana-Champaign, an MS in Real Estate from Johns Hopkins University and a PhD in Land Economics from the University of Cambridge in England.
Media Inquiries
Please contact Kathryn Hamilton, vice president for marketing and communications, at hamilton@naiop.org.
Disclaimer
This project is intended to provide information and insights to industry practitioners and does not constitute advice or recommendations. NAIOP disclaims any liability for actions taken as a result of this project and its findings.
© 2022 NAIOP Research Foundation
Endnotes
1 The Development Approval Index: A New Tool to Evaluate Local Approval Processes provides additional information on how the Index is constructed and weighted.
2 Regions based on a consolidation of census regions as defined in U.S. Census Bureau, “Census Regions and Divisions of the United States,” https://www2.census.gov/geo/pdfs/maps-data/maps/reference/us_regdiv.pdf.
3 Cushman & Wakefield, “U.S. National Industrial Q4 2021 Marketbeat Report,” 2022, https://www.cushmanwakefield.com/en/united-states/insights/us-marketbeats/us-industrial-marketbeat. Note that “Northern Virginia” is included as a market in the report, so the table combines two representative jurisdictions: Fairfax and Loudoun Counties. Population data (July 2021) and Median Household Income data (2020 dollars) are from U.S. Census Bureau, “Quick Facts,” https://www.census.gov/quickfacts/US.
4 Cushman & Wakefield, “US National Industrial Q4 2021”; Cushman & Wakefield, “Industrial Marketbeat, Q4 2021 San Antonio Industrial Report,” 2022, https://www.cushmanwakefield.com/en/united-states/insights/us-marketbeats/San-Antonio-marketbeats.
5 Jurisdictional boundaries and submarket areas do not align perfectly, so, as appropriate, market data is an average of multiple submarkets and includes all industrial product types, taken from Cushman & Wakefield, “Industrial Marketbeat, Q4 2021 Phoenix Industrial Report,” 2022, https://www.cushmanwakefield.com/en/united-states/insights/us-marketbeats/Phoenix-marketbeats.
