More Destinations or Faster Roads: Thinking of Traffic Congestion Like a Traveler
Access to jobs and services could be a more important metric than time spent commuting.
Transportation concerns in urban areas have largely focused on congestion and the best techniques to reduce it. The usual solution is to propose more capacity to serve population growth and improve speeds on roads.
However, a broader measure of how well the transportation system meets people’s needs is not how fast you go, but what you can reach — for work, shopping, school or other activities. Incorporating such measures would create a better understanding of the performance of urban transportation.
In an article in the May 2021 issue of the ITE Journal, published by the Institute of Transportation Engineers, analysts Eric Sundquist and Chris McCahill suggest that “in an ideal world, we would use quantifiable measures of accessibility to develop the best projects.” Such a place-based approach also makes it possible to address the needs of minority communities, which have often been harmed by past transportation decisions, especially highway projects.
What Congestion?
Across the U.S., automobile congestion almost disappeared when COVID-19 shut down much of the economy starting in the spring of 2020. The impact on travel was immediate and dramatic. According to the Texas A&M University Transportation Institute’s Urban Mobility Report for 2020, the congestion curve flattened dramatically in the 494 urban areas studied during the initial shutdown period, and shorter rush hours returned to cities when the “closer to normal” period hit in the fall.
The estimated yearly delay per auto commuter was cut in half across all urban areas, dropping to a level last seen in the 1990s. Among areas with populations greater than 3 million, delays during the September-to-December period remained 40% below the first quarter.
The bigger picture for travelers was the sharp drop in average delays per commuter. There was at least a 60% decline for Los Angeles, Washington, D.C., Seattle, Miami, Phoenix and San Diego. Such dramatic changes for these regions, and nearly every other metro area, were unimaginable within the traditional approaches to managing congestion; widening roads, expanding transit and encouraging people to reduce travel.
How Many Jobs Are Within Reach?
As COVID-19 curtailed commutes across the country, it invited a broader approach to evaluating the impact of transportation. For example, instead of measuring delays caused by congestion, a different metric could compare how many employment opportunities can be reached from a location.
Accessibility is a broader measure of the performance of a transportation system. It can be used across different modes of travel, from driving to mass transit as well as walking and biking. It reflects not only the speed of transportation, but also the extent to which land use trends are moving people and jobs farther from urban cores or closer in. For example, the pre-COVID 2019 data from the University of Minnesota’s Accessibility Observatory showed that despite growing congestion overall, there were 10 metro areas with large increases in job accessibility by auto, almost all of them in the Sun Belt.
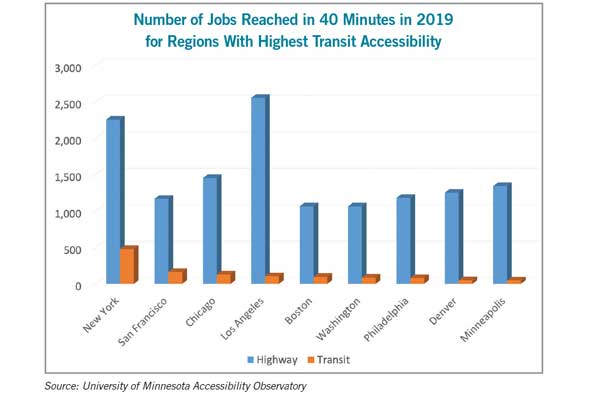
Additionally, studies by the Accessibility Observatory have found that in 14 of the largest urban regions, residents can reach more than a million jobs in a 40-minute drive, even before the pandemic shutdowns. Even in Los Angeles and New York, two of the nation’s most congested regions, the average worker was able to reach more than 2 million jobs in 40 minutes, creating vast opportunities for workers making an average commute.
Meanwhile, mass transit produced significantly lower levels of accessibility than driving because of slower speeds and longer waiting times. Workers in the New York region were able to reach only a fifth as many jobs in a 40-minute transit commute as they could by car. Mass transit in San Francisco reached about 14% of jobs in 40 minutes compared to commuting by car, and in Chicago, Boston and Washington, the figures ranged from 8%-9%. Despite substantially lower accessibility for mass transit compared to automobiles, the absolute level of jobs reached was almost 500,000 in New York, more than 100,000 for Los Angeles, Chicago and San Francisco, and almost 100,000 for Boston, Philadelphia and the Washington, D.C. region.
These levels of accessibility were for 2019, before the substantial reductions in transit ridership, and in some cases service, due to rider concerns during COVID-19. In April 2020, ridership on New York City’s subway system, the nation’s largest, was just 8% of the normal volume, according to a September 2020 report commissioned by APTA and published by Sam Schwartz Consulting.
What Shops and Services are Available?
Beyond commuting, access to a range of services is a hallmark of a desirable community. Developers have frequently sought to incorporate schools and retail within or near residential communities, and planners have also sought such a balance. As a reaction to sprawling places where it is necessary to get into a car to get a quart of milk, planners are proposing initiatives such as accessible 20-minute neighborhoods to enhance livability.
For example, Ottawa revised its growth blueprint in 2019 to create a community of 15-minute neighborhoods where people can get to most of their daily destinations — schools, grocery stores, transit, parks and libraries — within a 15-minute walk.
Portland, Oregon’s “20-minute neighborhood” model, used since 2010, calls for 90% of residents to be able to easily walk less than 20 minutes to meet non-work needs such as grocery shopping, dining and transit.
Tempe, Arizona, has a goal of making daily needs, excluding commutes, reachable within 20 minutes for all its residents by walking, cycling and mass transit.
A significant aspect of these initiatives is the emphasis on creating and maintaining livable communities with pedestrian access rather than less road congestion. For example, some communities are actually reducing posted speeds in residential neighborhoods.
Comparing accessibility values for non-work purposes offers an opportunity to evaluate the adequacy of services for different communities. This has always been critical for emergency services such as police and fire to assure an emergency response within an acceptable time. It’s also been useful for creating public school boundaries that minimize walking. Access to other public services like libraries and community facilities, as well as retailers, helps make communities more desirable. Enhanced accessibility for non-work activities probably requires a combination of transportation improvements and better planning for local services.
Making the Unusual Link Between Transportation and Land Development Decisions
Given the seemingly obvious connection between transportation and land use decisions, it is probably surprising to most people that they are not usually connected at the policy level. Land use and zoning decisions are the province of localities, while major transportation projects are generally funded by state departments of transportation, which try to avoid local politics.
Even local governments typically separate planning departments from transportation agencies. However, this is beginning to change in California, Hawaii and Virginia, which are using accessibility for planning. The Virginia Department of Transportation has incorporated accessibility analyses as a component for prioritizing funding of transportation projects.
Local governments are also recognizing the importance of local accessibility. The Southeast Michigan Council of Governments has benchmarked access to seven core services — fixed-route transit, jobs, health care facilities, supermarkets, parks, schools and libraries — to identify gaps and challenges where accessibility is low, and to help make regional transportation plans more responsive.
And in 2021, the Delaware Valley Regional Planning Commission asked Temple University graduate students to evaluate eight major transportation projects in the Philadelphia region on their impacts, including access from an equity lens. Such broader accessibility measures are more understandable to the general public and can help mitigate the harm of transportation projects on minority communities.
Robert Dunphy is a transportation consultant, an Emeritus Fellow of the Transportation Research Board, and an adjunct professor in Georgetown University’s Real Estate Program in the School of Continuing Studies.

RELATED ARTICLES YOU MAY LIKE

From the Editor: As the Economy Improves, What’s Next for CRE?
Fall 2023 Issue

Construction Cost Challenges Shift from Materials to Labor
Fall 2023 Issue