


The NAIOP CRE Sentiment Index
Release Date: October 2025
Key Findings
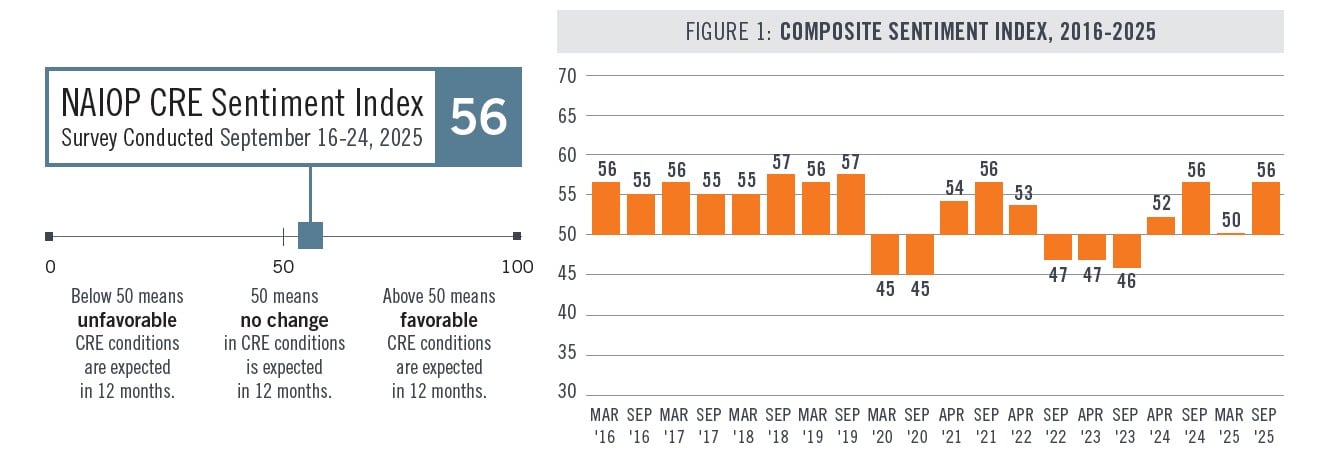
The NAIOP CRE Sentiment Index for September 2025 is 56, an increase from the March 2025 score, indicating that respondents expect conditions for commercial real estate to improve over the next 12 months (see Figure 1).
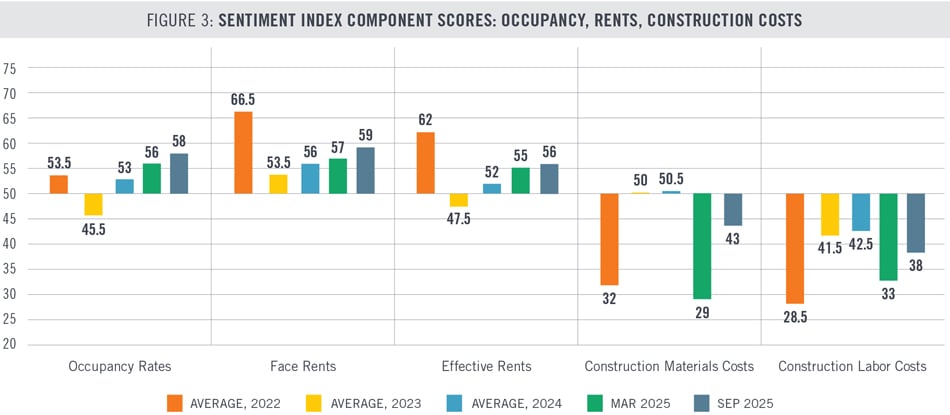
Respondents expect that construction material and labor costs will rise, but more slowly than anticipated in the spring. Respondents are much less pessimistic about the increase in material costs (score of 43) than they were in March (score of 29), suggesting they believe tariffs will have a smaller effect than previously feared.
Expectations for declining interest rates are driving optimism about future capital markets conditions. Respondents expect the availability of both equity and debt to increase more quickly than in the March survey.
Respondents are slightly more optimistic about occupancy rates and rents than they were in the spring. Open-ended comments suggest that the slowdown in construction activity over the past few years due to higher interest rates and construction costs is now translating to a tighter supply of available properties, contributing to a stabilization in vacancy rates.
Respondents are more optimistic about the direction of cap rates than at any point since the survey was launched in 2015. The expectation that cap rates will decline is in line with currently elevated cap rates for most commercial properties, and with expectations that interest rates will decline and properties’ operating performance will improve.
Developers and building owners plan to increase their deal volume over the next 12 months. These respondents expect the dollar volume of projects and acquisitions to increase more quickly than in March (score of 62 vs. 57).
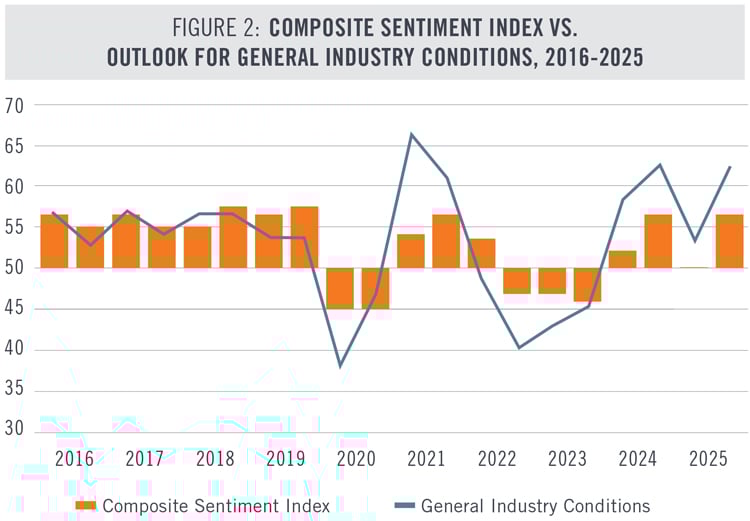
Respondents expect general industry conditions to improve significantly over the next 12 months. The score for general industry conditions (62) is calculated separately from the CRE Sentiment Index. A higher score than the Index may be attributable to an improved outlook for the economy overall. Asked separately, developers and building owners indicated they expect favorable local economic conditions over the next 12 months.
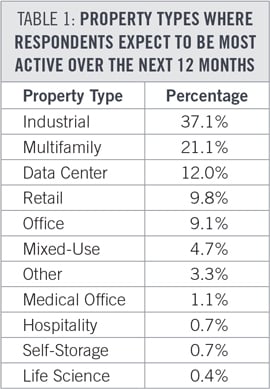
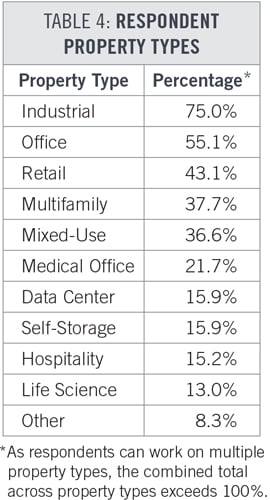
As a whole, respondents expect to be most active in industrial and multifamily real estate during the next 12 months (see Table 1). Data centers, retail and office properties are expected to attract the next highest levels of interest. More respondents indicated they plan to be active primarily in data center and retail properties than was the case in March.
Notable Changes in the Fall 2025 Survey
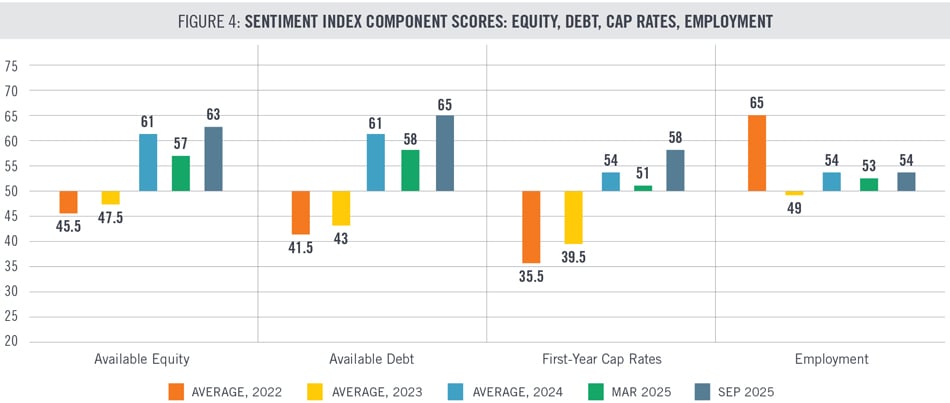
Figures 3 and 4 compare respondent expectations in Fall 2025 for the individual components that comprise the NAIOP CRE Sentiment Index to expectations in past surveys. For component scores from before 2022, please refer to past editions of this report. Values above 50 represent expectations that a condition will be more favorable for development over the next 12 months (e.g., higher face rents, lower construction labor costs, lower cap rates). Values below 50 represent expectations that a condition will be less favorable during the next 12 months.
The largest shift for any single component of the Index since March is that respondents now expect construction material costs to rise less rapidly. Concerns about tariffs and their effect on construction costs and the broader economy nonetheless featured prominently in several respondents’ comments. The outlook for construction labor costs is somewhat less pessimistic. Respondents also now expect a slightly stronger improvement in occupancy rates, face rents and effective rents.
An improved outlook for capital market conditions also contributed significantly to the rebound in the CRE Sentiment Index. With the Federal Reserve cutting the federal funds rate by 25 basis points in September and additional cuts expected, respondents now expect more favorable interest rates in the future. Respondents’ expectations for the availability of debt and equity, as well as first-year cap rates, all improved compared to March. Expectations for employment in their own firms remain positive.
Expectations for Development Conditions
The survey asks developers and building owners to evaluate how important interest rates, local economic conditions, local development approvals processes, environmental regulations and other government regulations will be to their decisions to initiate or continue development projects over the next 12 months (answers are not factored into the NAIOP CRE Sentiment Index). The survey then asks developers how favorable they expect these conditions to be. The results are described in Table 2 on a 100-point scale.

Respondents continue to rank local economic conditions and interest rates as the two most important factors in their development decisions. Respondents are now more optimistic about future local economic conditions and interest rates than they have been in the past three years. Respondents are also less pessimistic about local development approvals, environmental regulations and other government regulations than at any time since these questions were added to the survey in March 2020. This shift may reflect recent permitting reforms undertaken by the federal government and by some state and local governments. However, as reflected in open-ended comments, developers continue to deal with challenging approvals processes in many jurisdictions.
Differences Between Developers and Non-developers

Respondents were asked to identify their primary profession. When comparing the responses of developers and building owners to non-developers, three statistically significant differences emerged related to the conditions that comprise the Sentiment Index (see Table 3). Non-developers expect employment in their own firms to expand, while developers and building owners are expecting a slight contraction. By contrast, developers and building owners expect that occupancy rates and face rents will rise faster than non-developers do. Differing expectations about future property performance may lead non-developers to value commercial properties and new development more conservatively compared with developers.
Direct From Survey Participants
“Higher construction cost, higher cost of capital and longer approval periods are slowing new additions to the market, thereby limiting new product and reducing vacancy and availability of existing product.”
“I believe the demand side is improving slowly and new construction has slowed due to costs. This will slightly improve occupancy and rents in 2026.”
“The office market will continue to improve. Equity is already coming back and debt will get more confident and available.”
“The small bay industrial market is on fire!”
“Lower interest rates are helpful, but the most challenging headwind is uncertainty in federal policies around trade.”
“The uncertainty around tariffs is creating hesitation among consumers and retailers, which could slow leasing activity in the near term.”
“Hearing the word ‘uncertainty’ a little bit less!”
“It is brutal trying to get through the permit process with the City of Tulsa.”
Methodology
The NAIOP CRE Sentiment Index is designed to predict general conditions in the commercial real estate industry over the next 12 months by asking industry professionals to predict conditions for their projects and markets. The NAIOP CRE Sentiment Survey is conducted biannually, in March/April and August/September. The survey is sent to roughly 10,000 NAIOP members in the U.S. who are developers, building owners, building managers, brokers, analysts, consultants, lenders and investors in commercial real estate. It asks questions about jobs, space markets, construction costs, capital markets and other conditions for real estate development. The questions that comprise the Sentiment Index are not equally weighted. Instead, weighting varies based on whether responses to a question are tightly packed or dispersed. Questions with tightly packed responses (meaning there is more consistency among the answers to that question) are more heavily weighted than those with more dispersed responses (which indicate less consistency).
If every participant in the survey selected the most optimistic answer to every question, the index would be 100. Conversely, if all the participants chose the most pessimistic response to every question, the index would be 0. The survey includes questions that evaluate sentiment about conditions that are not included in the composite score but are measured separately on a 100-point scale.
A cross-tabulation of the September survey results by respondent profession revealed three questions in which differences between responses were statistically significant. Differences that were not statistically significant are not reported in this analysis.
A total of 276 respondents from 232 distinct companies participated in this survey. A breakdown of the property types that respondents work on is provided in Table 4.
A regional breakdown shows that 47.1% of respondents are active in the West, 43.8% are active in the South, 28.3% are active in the Midwest and 26.1% are active in the East.
The statistical methodology for the Sentiment Index was originally developed by Tom Hamilton, Ph.D., MAI, CCIM, CRE, the Gerald Fogelson Distinguished Chair of Real Estate in the Chicago School of Real Estate at Roosevelt University. The survey data was collected by the NAIOP Research Foundation, and the survey questions were created, refined and finalized between 2014 and 2023 with the assistance of several NAIOP Distinguished Fellows. Shawn Moura, Ph.D., Vice President for the NAIOP Research Foundation, authored the current edition of the survey and this summary analysis. For questions about the CRE Sentiment Index, please contact Shawn at moura@naiop.org.
Media Inquiries
Please contact Kathryn Hamilton, vice president for marketing and communications, at hamilton@naiop.org.
