


Office Space Demand Forecast, Second Quarter 2020
Release Date: May 2020
Effects of COVID-19 Global Pandemic Predicted to Decrease U.S. Office Demand
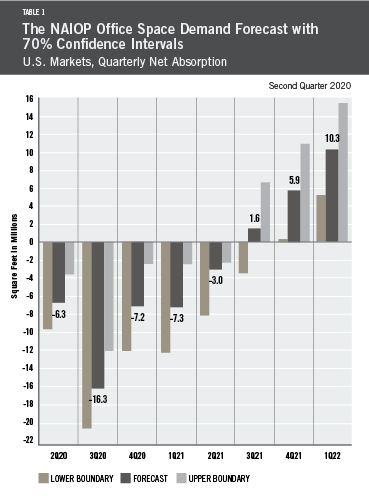 Since March 2020, COVID-19 has markedly altered the U.S. macroeconomic landscape as states issued stay-at-home orders designed to limit the spread of the disease. Since the first U.S. case was identified in January 2020, nearly 1.5 million diagnoses have been reported, and more than 80,000 individuals have died. Workers across multiple industries are staying home, and it is unclear how or when they will return to their workplaces. Due to the turmoil in the national economy, rising unemployment and continued uncertainty about future work arrangements, the U.S. office market absorption is forecast to decline into negative territory through the second quarter of 2021. The steepest declines may be experienced in the third quarter of 2020, with NAIOP’s model forecasting a drop of 16.3 million square feet. Absorption rates will increase as the economy begins to gain traction in 2021 (see Table 1).
It is important to note the limitations of forecasting during a pandemic as models rely on past information to predict future events, and few historical data points are comparable to current circumstances. Forecast uncertainty tends to rise with economic uncertainty. Additionally, office space demand is highly correlated with the state of the economy. Therefore, authors Drs. Hany Guirguis and Tim Savage have updated the economic assumptions used to forecast office absorption. U.S. Gross Domestic Product (GDP) was predicted to have contracted by 2.5% in Q1 2020 and to contract further by 6.25% in Q2. A gradual return to economic expansion is predicted to occur with forecasted growth of 1% in Q3 2020 and 1.25% in Q4 2020. Average unemployment during 2020 and 2021 was estimated to be 7%, with average inflation around 1%.
The virus’ macroeconomic impact is now quite visible in U.S. data. The 10-year U.S. Treasury, the most liquid asset traded on international markets and a bellwether of market expectations for economic growth, has fallen over 120 basis points (bps) during Q1 2020. Market expectations of long-term inflation, as measured by the 10-year break-even inflation rate (T10YIE), have declined by over 60 bps in Q1 2020. At the end of Q1 2020, they remained nearly 100 bps below the Federal Reserve’s stated inflation target of 2%. Market volatility, as measured by the VIX (VIXCLS), has risen to levels not seen since the 2007-2008 global financial crisis.
During Q1 2020, more than 26 million individuals filed a first-time claim for unemployment insurance (UI). In response, the Federal Reserve lowered its target Fed Funds rate to between 0 and 25 bps. Recognizing its mission as a lender of last resort, it expanded its balance sheet by nearly 60% to more than $6.5 trillion. The federal government has passed two pieces of legislation aimed at providing income support to individuals who have been furloughed or laid off, as well as providing lending facilities to small- and medium-sized businesses. These commitments may comprise an additional $3 trillion in federal obligations. In turn, investors have fled to the most liquid instruments available. Total assets in money market mutual funds (MMMFFAQ275) are approaching cycle highs. In others words, by any measure, the U.S. faces the economics of a liquidity trap, in which investors seek the most liquid assets and traditional interest-rate monetary policy has little or no traction.
While the economic benefits of density and agglomeration are well-documented, COVID-19 may necessitate a type of “de-densification” in office space, at least in the near term.1 As a result, current office-using space will face short-term logistical challenges. While U.S. states begin the process of a staged re-opening, employees will arguably put a premium on workplace cleanliness. They will also put a premium on personal space, which may contribute to increased demand for office space. Many large organizations have begun to consider a “hub-and-spoke” model for work arrangements, enhanced by technology that allows for the economic gains from agglomeration while recognizing the challenges created by the pandemic.2
Actual Versus Forecast
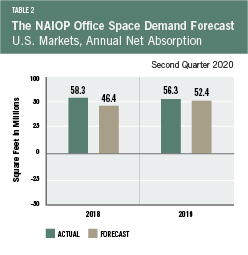
Table 2 compares the forecast to actual net absorption. The forecast for 2019 was 52.4 million square feet, which is 3.9 million square feet less than the 56.3 million square feet that were actually absorbed for the year. The forecast for 2018 was 46.4 million square feet, which is 11.9 million square feet less than the 58.3 million square feet that were actually absorbed for the year. CBRE revised upward the 2018 net absorption figures during the year. Lagged net absorption is a significant variable in the NAIOP Office Space Demand Forecast, so this restatement had significant impacts on the calculation of the fourth quarter 2018 forecast total (11.6 million square feet on average per quarter for 2018) compared to the prior forecast issued in the second quarter of 2018 (8.4 million square feet on average per quarter).
Key Inputs and Disclaimers
In January 2016, the NAIOP Research Foundation published “Forecasting Office Space Demand,” a model that forecasts net absorption of U.S. office space on a quarterly basis for eight consecutive quarters. Created by researchers Hany Guirguis, Ph.D., of Manhattan College and Joshua Harris, Ph.D., CRE, CAIA, of New York University, the model is similar to that used for the NAIOP Industrial Space Demand Forecast, which successfully projected a drop and rebound in net absorption of industrial space in 2009 and 2010. (The industrial space demand model was created by Guirguis along with Randy Anderson, Ph.D., then at the University of Central Florida.) Below are the leading, coincident and lagging variables used in the office space demand forecast.
- The growth rate in real gross domestic product (GDP) captures the broadest level of macroeconomic activity, reflecting the value of all goods and services produced in a given year.
- Corporate profits of domestic industries directly captures the financial capacity and growth of firms that may need to expand. Profits are a source of retained earnings, so they provide a clue about how much money is available to fund investments in plants and equipment, an investment activity that raises productive capacity.
- Total employment in the financial services sector is a direct measure and proxy for office-using employment that best fits with changes in office space demand.
- Two variables from the Institute for Supply Management’s Non-Manufacturing Indices serve as proxies for a sentiment measure on the future health of office-using firms. The ISM-NM Inventories Index measures increases and decreases in inventory levels, while the ISM-NM Supplier Deliveries Index measures how long it takes suppliers to deliver parts and materials that are integral to service sector businesses.
These five measures — along with the lagged measures of net absorption of office space, which serve as the base of the model — make possible an accurate two-year forecast of net absorption of office space nationwide. The methods used in the forecast are dynamic rather than static, to account for the changing nature of the underlying macro economy.
Office absorption data are provided by CBRE Econometric Advisors, which assumes no responsibility for this forecast. The absorption forecast tracks with CBRE office data and may vary when compared to other data sets. Data include office buildings in the U.S. with a minimum rentable building area that ranges from 10,000 to 150,000 square feet, depending on the market.
This forecast is based on first-quarter 2020 data.
1 Jan K. Brueckner, Lectures on Urban Economics. The MIT Press, 2011.
2 “5 Questions with Professor Timothy Savage,” NYU Alumni Association, 2020, http://video.alumni.nyu.edu/detail/videos/event-recaps/video/6153523347001/5-questions-with-professor-timothy-savage
