


Office Space Demand Forecast, Second Quarter 2018
Release Date: May 2018
Office Market Conundrum: Improving Economic Indicators amidst Minimal Absorption
The U.S. office markets averaged just 4.4 million square feet of positive net absorption over the past two quarters; specifically, 7.4 million square feet were absorbed in the fourth quarter of 2017 and just 1.3 million square feet were leased on a net basis in the first quarter of 2018, according to CBRE. These figures came in significantly below the 10.8 million square foot quarter average forecast six months ago.
Dr. Hany Guirguis, Manhattan College, and Dr. Joshua Harris, New York University, believe that this performance represents a significant conundrum as every economic indicator used to forecast absorption performed at or above the forecast level. Some of those indicators included the Institute for Supply Management’s Non-Manufacturing Purchasing Managers’ Index and related measures such as the Conference Board Measure of CEO Confidence. Further, closely related macroeconomic variables – such as office using employment – grew steadily, meaning that more office employees were added without much corresponding space leased over the previous six months. While the first quarter reading of just 1.3 million square feet absorbed may be a one-time anomaly, it cannot be discounted that a structural shift in the office space market has or is occurring.
Allowing for the probability of a shift in office leasing, given the current level of economic activity, the forecast for net absorption of office space has been reduced to 8.4 million square feet for the remaining three quarters of 2018 and 10.0 million square feet per quarter in 2019. The most plausible explanation for this 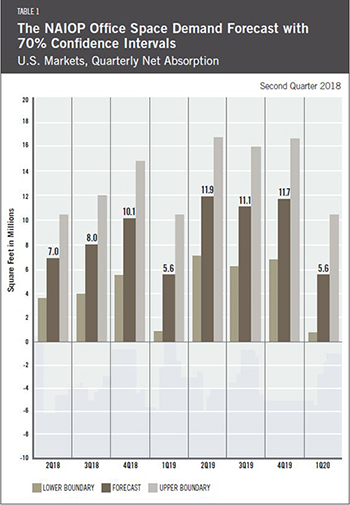 shift is efficiency gains in office space utilization; however, there will be a rational limit on how far these gains can go. At some point, demand for office space (in terms of square footage) should increase, assuming economic growth and employment gains continue, especially if there is growth in the office using sectors. Further, it is plausible that lack of specificity regarding elements of the new federal tax law, as well as late first quarter threats about “trade wars,” may have caused some companies to temporarily delay expansion plans. If that was the case, then the rest of 2018 may show outpaced gains in net absorption.
Overall, an analysis of the economy, including the variables known to explain office demand, suggest that office markets should be getting healthier, yet the national vacancy rate has moved up by 40 basis points over the past six months according to CBRE. Thus, office developers should exercise caution in moving forward on speculative projects in many markets. Given that current completion rates are still below long-term averages and that asking rents are still rising, it is logical to believe that the space markets will improve in future quarters. Further, many developers, lenders, and even tenants are not over expanding or being overactive, meaning that there is a low likelihood that there will be excess space that they will need to vacate in a downturn. Hence, the cautious behavior now should result in less pain for the office markets in the next downturn, which may occur in late 2019 or 2020.
Key Inputs and Disclaimers
In January 2016, the NAIOP Research Foundation published “Forecasting Office Space Demand,” a model that forecasts net absorption of U.S. office space on a quarterly basis for eight consecutive quarters. Created by researchers Hany Guirguis, Ph.D., of Manhattan College and Joshua Harris, Ph.D., CRE, CAIA, then at the University of Central Florida, the model is similar to that used for the NAIOP Industrial Space Demand Forecast, which successfully projected a drop and rebound in net absorption of industrial space in 2009 and 2010. (The industrial space demand model was created by Guirguis along with Randy Anderson, Ph.D., then at the University of Central Florida.) Below are the leading, coincident and lagging variables used in the office space demand forecast.
- The growth rate in real gross domestic product (GDP) captures the broadest level of macroeconomic activity, reflecting the value of all goods and services produced in a given year.
- Corporate profits of domestic industries directly captures the financial capacity and growth of firms that may need to expand. Profits are a source of retained earnings, so they provide a clue about how much money is available to fund investments in plant and equipment, an investment activity that raises productive capacity.
- Total employment in the financial services sector is a direct measure and proxy for office-using employment that best fits with changes in office space demand.
- Two variables from the Institute for Supply Management’s Non-Manufacturing Indices serve as proxies for a sentiment measure on the future health of office-using firms. The ISM-NM Inventories Index measures increases and decreases in inventory levels, while the ISM-NM Supplier Deliveries Index measures how long it takes suppliers to deliver parts and materials that are integral to service sector businesses.
These five measures — along with the lagged measures of net absorption of office space, which serve as the base of the model — make possible an accurate two-year forecast of net absorption of office space nationwide. The methods used in the forecast are dynamic rather than static, to account for the changing nature of the underlying macro economy.
Office absorption data are provided by CBRE Econometric Advisors, which assumes no responsibility for this forecast. The absorption forecast tracks with CBRE office data and may vary when compared to other data sets. Data include office buildings in the U.S. with a minimum rentable building area that ranges from 10,000 to 150,000 square feet, depending on the market.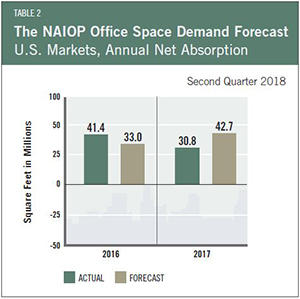
Actual versus Forecast
Table 2 compares forecast to actual net absorption. The forecast released in the fourth quarter of 2017 was for 42.7 million square feet, which was 11.9 million square feet above the actual square footage absorbed for the year.
This forecast is based on first quarter 2018 data.
