


Office Space Demand Forecast, Second Quarter 2017
Release Date: May 2017
Solid Office Demand Forecast for 2017 as Optimism Intensifies
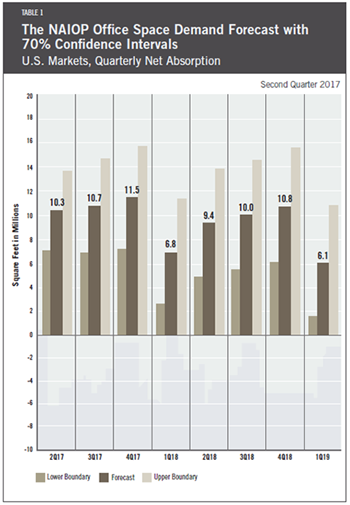
As the economy improves, so does the forecast for net absorption of office space. According to Dr. Hany Guirguis, Manhattan College, and Dr. Joshua Harris, University of Central Florida, the forecast calls for approximately 39.7 million square feet to be absorbed in 2017 — about 10 million square feet per quarter — similar to the 41.4 million square feet actually absorbed in 2016. The current model forecasts a slight decline — to 37.1 million square feet — of positive net absorption in 2018. However, that is based on fourth quarter 2016 data that reflects pre- and post-election uncertainty. As the Trump administration’s political agenda takes hold, the forecast will likely be revised.
The fourth quarter of 2016 produced significantly higher net absorption than had been forecast (14.8 million square feet compared to 7.8 million square feet), driven by greater-than-expected hiring in the office-using sectors of the economy. Growth in office-using employment has been significantly ahead of growth in all of the non-farm employment categories, according to the Bureau of Labor Statistics. It finds, in the first quarter of 2017, a 2.52 percent annualized growth rate in office-using jobs versus 1.58 percent growth in overall non-farm employment.
If growth in office-using employment — which has been focused mostly in the Professional and Business Services category — continues at such a pace, the need for office space will expand rapidly and thus cause actual absorption to come in near or above the high limit of the forecast. However, prior experience suggests that growth in the number of office-using jobs will likely come down as it moves closer to the overall employment growth average over the long-term. The forecast is also driven, in part, by expectations of higher short- and long-term interest rates; such impacts drive the model to temper the forecast, resulting in slight moderation in predicted net absorption in 2018.
Many uncertainties remain, including potential tax reform, health care reform, and even fundamental changes in federal budgeting. If President Donald Trump can strike deals on some or all of these fronts in ways that are favorable to business, the economy may experience a significant increase in the rate of overall growth, increasing annual GDP growth to between 2.5 percent and 3.5 percent.
Both CEO and consumer confidence remain very high and have been rising steadily since the election, signaling that many market participants still expect growth. As such, the potential for office demand that is higher than forecast is very real, yet difficult to predict.
To sum up: the U.S. office market appears to be very healthy as of the first quarter of 2017. Actual net absorption is much more likely to surprise to the upside than to the downside, at least for the remainder of the year. The binding constraint to robust net absorption may end up being available space, as more and more markets are short on vacant, high-quality office space for tenants with immediate needs. According to CBRE data, office completions averaged 9.4 million square feet per quarter in 2016, still off of the long-term average of 12.4 million square feet per quarter from the inception of the data series. The risk of oversupply is presently very low.
Key Inputs and Disclaimers
In January 2016, the NAIOP Research Foundation published “Forecasting Office Space Demand,” a model that forecasts net absorption of U.S. office space on a quarterly basis for eight consecutive quarters. Created by researchers Hany Guirguis, Ph.D., of Manhattan College and Joshua Harris, Ph.D., CRE, CAIA, of the University of Central Florida, the model is similar to that used for the NAIOP Industrial Space Demand Forecast, which successfully projected a drop and rebound in net absorption of industrial space in 2009 and 2010. (The industrial space demand model was created by Guirguis along with Randy Anderson, Ph.D., of the University of Central Florida.) Below are the leading, coincident and lagging variables used in the office space demand forecast.
- The growth rate in real gross domestic product (GDP) captures the broadest level of macroeconomic activity, reflecting the value of all goods and services produced in a given year.
- Corporate profits of domestic industries directly captures the financial capacity and growth of firms that may need to expand. Profits are a source of retained earnings, so they provide a clue about how much money is available to fund investments in plant and equipment, an investment activity that raises productive capacity.
- Total employment in the financial services sector is a direct measure and proxy for office-using employment that best fits with changes in office space demand.
- Two variables from the Institute for Supply Management’s Non-Manufacturing Indices serve as proxies for a sentiment measure on the future health of office-using firms. The ISM-NM Inventories Index measures increases and decreases in inventory levels, while the ISM-NM Supplier Deliveries Index measures how long it takes suppliers to deliver parts and materials that are integral to service sector businesses.
These five measures — along with the lagged measures of net absorption of office space, which serve as the base of the model — make possible an accurate two-year forecast of net absorption of office space nationwide. The methods used in the forecast are dynamic rather than static, to account for the changing nature of the underlying macro economy.
Office absorption data are provided by CBRE Econometric Advisors, which assumes no responsibility for this forecast. The absorption forecast tracks with CBRE office data and may vary when compared to other data sets. Data include office buildings in the U.S. with a minimum rentable building area that ranges from 10,000 to 150,000 square feet, depending on the market.
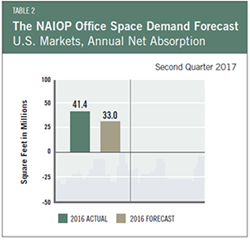
Actual versus Forecast
Table 2 compares forecast to actual net absorption for the first year that this forecast was released. The forecast released in the fourth quarter of 2016 was for 33.0 million square feet, which was 8.4 million square feet below the actual square footage absorbed for the year.
This forecast is based on first quarter 2017 data.
