


Office Space Demand Forecast, Fourth Quarter 2017
Release Date: November 2017
Demand for Office Space to Increase as Economy Strengthens
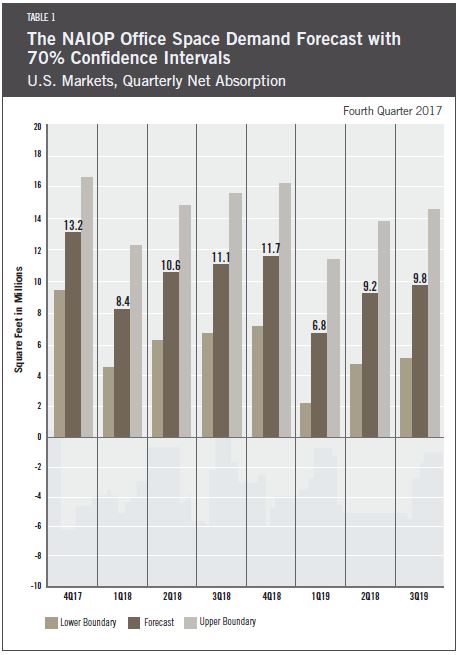
With two consecutive quarters of annualized U.S. GDP growth exceeding 3.0 percent — as well as general strength in most other economic indicators, such as the U.S. unemployment rate as measured by the U.S. Bureau of Labor Statistics and the U.S. consumer confidence index as measured by the Conference Board — net absorption of office space is forecast to move up to an average of 10.4 million square feet per quarter in 2018, from 9.3 million square feet per quarter in the forecast issued six months ago.
Dr. Hany Guirguis, Manhattan College, and Dr. Joshua Harris, New York University, also forecast a slight decline in net absorption for 2019; however, the 2019 decline is not expected to be as great as the contraction forecast six months ago. Additionally, the decline could be pushed further out as the economy appears to be accelerating going into 2018.
The current economic expansion has now lasted more than eight years and the consensus of economists is for it to continue for at least one more year, if not two. There have yet to be signs of significant overinvestment or overheating in the economy, the forces that normally lead to recessions. If this holds true, office absorption should remain healthy for the foreseeable future.
The previous two quarters of net absorption of office space averaged 11.0 million square feet per quarter compared to the 10.5 million square feet forecast; thus, the model appears to be well functioning, despite relatively high quarterly variance. The major unknown affecting the forecast for the next year is what, if anything, will transpire in Washington, D.C., relative to tax reform and other major policy initiatives. Uncertainty persists, despite the fact that the U.S. presidential election took place more than one year ago.
The markets show signs of optimism concerning agreements about reductions in corporate tax rates. Failure of such could reduce optimism, followed by a downturn in economic growth and a decline in demand for office space. It is likely that any major departures from the space demand forecast in 2018 will be due to surprise shocks of the geopolitical type (items that are far outside the scope of most forecasts).
Office-using employment sectors remained robust for three quarters in 2017, but this has yet to translate into major demand for office space. In fact, it appears that new office layouts (benching, open addressing, etc.) and nontraditional tenants such as coworking operators, may impact the office space markets more so than previously thought. Coworking firms such as WeWork are leasing large blocks of space in a growing number of markets and releasing the space in bulk to Fortune 500 companies seeking short-term, flexible arrangements. In previous recoveries, office landlords captured the excess profits generated by undersupply in the form of rapidly rising rents; in the current recovery, it appears intermediaries such as WeWork are earning some of that spread.
While demand for coworking spaces has been attributed mainly to small entrepreneurial entities, there is growing evidence that major corporations are preferring this arrangement over long-term, inflexible leases offered by most traditional landlords.
In terms of forecasting office space demand, it is hard to judge by how much the coworking model will change demand for office space. One effect with the most probability is that increases and decreases in demand will modulate as these intermediary firms lease more space, making the ebb and flow of available space less visible to the market, but more visible on their balance sheets. This will be a trend to watch in the office leasing data in 2018.
Key Inputs and Disclaimers
In January 2016, the NAIOP Research Foundation published “Forecasting Office Space Demand,” a model that forecasts net absorption of U.S. office space on a quarterly basis for eight consecutive quarters. Created by researchers Hany Guirguis, Ph.D., of Manhattan College and Joshua Harris, Ph.D., CRE, CAIA, then at the University of Central Florida, the model is similar to that used for the NAIOP Industrial Space Demand Forecast, which successfully projected a drop and rebound in net absorption of industrial space in 2009 and 2010. (The industrial space demand model was created by Guirguis along with Randy Anderson, Ph.D., then at the University of Central Florida.) Below are the leading, coincident and lagging variables used in the office space demand forecast.
- The growth rate in real gross domestic product (GDP) captures the broadest level of macroeconomic activity, reflecting the value of all goods and services produced in a given year.
- Corporate profits of domestic industries directly captures the financial capacity and growth of firms that may need to expand. Profits are a source of retained earnings, so they provide a clue about how much money is available to fund investments in plant and equipment, an investment activity that raises productive capacity.
- Total employment in the financial services sector is a direct measure and proxy for office-using employment that best fits with changes in office space demand.
- Two variables from the Institute for Supply Management’s Non-Manufacturing Indices serve as proxies for a sentiment measure on the future health of office-using firms. The ISM-NM Inventories Index measures increases and decreases in inventory levels, while the ISM-NM Supplier Deliveries Index measures how long it takes suppliers to deliver parts and materials that are integral to service sector businesses.
These five measures — along with the lagged measures of net absorption of office space, which serve as the base of the model — make possible an accurate two-year forecast of net absorption of office space nationwide. The methods used in the forecast are dynamic rather than static, to account for the changing nature of the underlying macro economy.
Office absorption data are provided by CBRE Econometric Advisors, which assumes no responsibility for this forecast. The absorption forecast tracks with CBRE office data and may vary when compared to other data sets. Data include office buildings in the U.S. with a minimum rentable building area that ranges from 10,000 to 150,000 square feet, depending on the market.
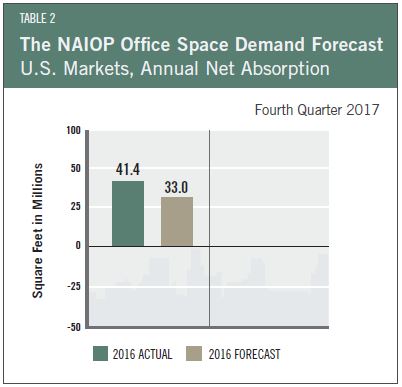
Actual versus Forecast
Table 2 compares forecast to actual net absorption for the first year that this forecast was released. The forecast released in the fourth quarter of 2016 was for 33.0 million square feet, which was 8.4 million square feet below the actual square footage absorbed for the year.
This forecast is based on third quarter 2017 data.
