


Office Space Demand Forecast, Fourth Quarter 2025
Release Date: December 2025
Office Market at Pivotal ‘Normalization’ Point as Macroeconomic Factors Weigh on Economy
Nationwide demand for office space experienced a large shift in momentum in the third quarter, with demand growing by 19.8 million square feet compared with negative net absorption of 14.9 million square feet in the second quarter. Although the most recent quarter was the strongest for the office sector since 2022, aggregate demand for office space is nearly unchanged from one year ago (up only 600,000 square feet) due to declining demand in the first half of the year. Supply pressures eased due to a slowdown in new construction and the repurposing of some office buildings for alternative uses such as residential, hospitality and data centers. With 25.3 million square feet of net new office space delivered over the last four quarters, nationwide vacancy rates have ticked up slightly, from 11.7% in the third quarter of 2024 to 11.9% as of the most recent quarter.
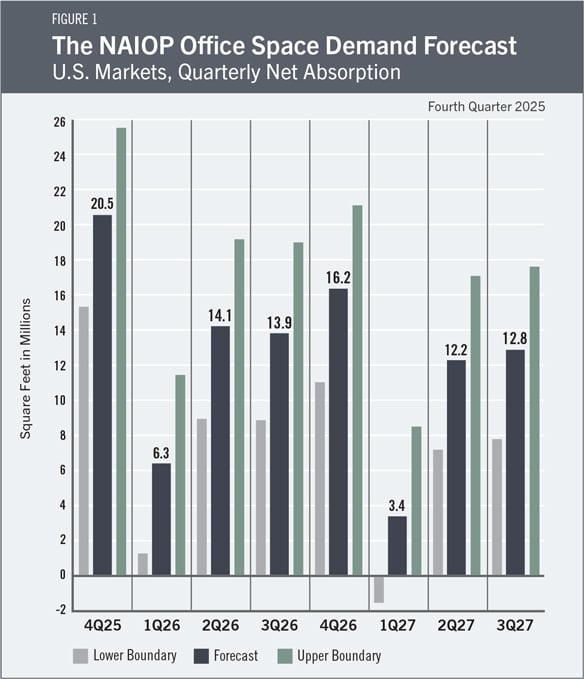
The sharp improvement in net absorption in the third quarter appears to signal the beginning of a recovery in the office market. Given current favorable economic conditions, large scale capital expenditures related to artificial intelligence (AI) and the performance of the office market in past periods of moderate economic growth, net office space absorption in the fourth quarter of 2025 is expected to be 20.5 million square feet, with another 50.5 million square feet of 6 positive absorption for the full year in 2026. The forecast projects 28.4 million square feet of positive absorption for the first three quarters of 2027. The current forecast assumes there is a 50% chance the recent increase in demand proves to be short-lived, in which case absorption would be lower than forecast.
The Office Market
Recent data on the office market suggest a continuation of several trends from earlier quarters but also a broadening of demand growth across geographic markets. Office building access records show a small gradual increase in office utilization, reflected in consistent year-over-year growth since 2023, as well as a continued bifurcation of demand that favors newer, high-quality office buildings. Kastle Systems reports Class A+ office buildings have experienced near-full utilization on peak days, while its 10-city average for all office properties shows peak utilization at just below two-thirds of the pre-pandemic average.1 Both technology and finance firms have contributed significantly to leasing activity in 2025, powering New York City’s standout performance (with positive net absorption every quarter since mid-2024) and helping markets like San Francisco find a bottom and begin their recovery.
However, the third quarter marks a departure from the recent past, when positive absorption was concentrated in a few markets or one or two larger geographic regions. Office net absorption was negative in every one of the four Census-defined regions (Midwest, Northeast, South, West) in the second quarter of 2025 but turned positive in every region in the third quarter, marking the first time all four regions experienced demand growth since 2021. The breadth of the turnaround supports the case that the most recent quarter could be the start of a more enduring trend of growing demand for office space. On the other hand, negative net absorption in the first three quarters of the year was at least partially driven by economic uncertainty associated with changes in U.S. trade policy. It is possible a significant portion of the third quarter’s rebound in demand was the product of delayed leasing activity that would otherwise have occurred earlier in the year. While the forecast’s predictive model suggests that office demand over the next eight quarters will look closer to the prepandemic pattern than it has since 2020, it is equally possible that the recent increase in demand proves to be temporary and that remote work continues to hamper more rapid growth. For this reason, the forecast equally weights these two scenarios.
Economic Factors
The U.S. macroeconomic outlook remains broadly positive but is subject to several identifiable, idiosyncratic risks that could alter the trajectory of economic output and hiring in 2026 and beyond. The federal government’s recent prolonged closure will likely negatively affect the economy and jobs market in the near term.2 Furthermore, the outcome of substantive federal policy decisions—including those related to tariff rates and health care policy—remains unclear. These decisions could have meaningful effects on consumers and businesses. There is also the open question of AI adoption by businesses of all sizes and what impact this may have on the labor market. These downside risks are likely to lead some businesses to delay investment decisions, which could directly impact the demand for office space in the U.S.
There is great potential for gains from investment in AI and from the general adoption of innovations that boost productivity. In fact, several turnarounds in local office market demand have been attributed to AI-related leasing activity by large firms and new startups in this space. A potential shift in tariff policy resulting from additional trade agreements or litigation could also spur activity by businesses that have deferred significant decisions as they wait for clarity.
While the outlook for business investment has improved since the last forecast, consumer sentiment has deteriorated. The University of Michigan Index of Consumer Sentiment fell to 50.3 in November, the second-lowest reading since 1978.3 Consumers remain sensitive to elevated prices. Should this result in a severe pullback in holiday spending, it could tip the country into recession. However, it should be noted that consumer spending has proven remarkably resilient to recent declines in sentiment.
Finally, the Federal Reserve’s recent cuts to the benchmark rate have created a tailwind for the economy. Lower rates will benefit businesses, consumers and the office space market. Office building owners and developers need capital to modernize and repurpose older buildings and office spaces. Any reduction in the cost of capital is likely to benefit the market, as it makes it easier for landlords and tenants to reach a deal that includes a tenant improvement allowance (and thus increase net absorption).
The Forecast Model
The model that informs this forecast draws from historical data on the economy and office real estate absorption to project future demand. Recent trends in office absorption suggest office sector performance will reflect economic conditions as it has in past economic cycles, although the amount of office space occupied per worker is lower than it was before 2020. The baseline out-of-sample forecast is illustrated in Figure 1. The current forecast assumes there is a 50% chance that the increase in net absorption in the third quarter is the beginning of a durable trend and a 50% chance that it proves to be a temporary increase in demand and thus weights the two scenarios equally.
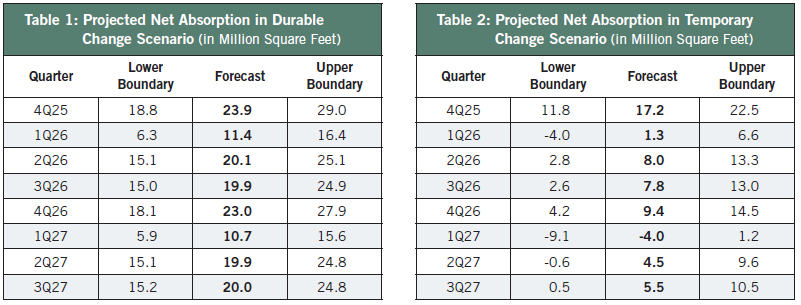
Table 1 provides the expected range in net absorption assuming that the recent increase in absorption reflects a durable change in demand. Table 2 provides the expected range assuming that the recent increase in absorption is temporary.
Actual Versus Forecast
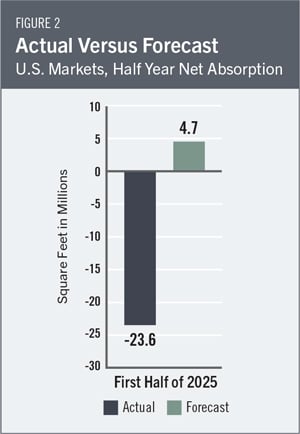
Figure 2 compares actual net absorption in the first half of 2025 to the sum of what the second-quarter forecast had projected for the second quarter and what the prior forecast had projected for the first quarter. The first year-over-year evaluation of the forecast will be provided when 10 full-year data are available for 2025. During the first half of 2025, the office market experienced 23.6 million square feet of negative absorption, compared with the forecast of 4.7 million square feet of positive absorption.
Key Inputs and Disclaimers
In January 2016, the NAIOP Research Foundation published “Forecasting Office Space Demand,” a model that forecasts net absorption of U.S. office space on a quarterly basis for eight consecutive quarters. Created by researchers Hany Guirguis, Ph.D., of Manhattan University, and Joshua Harris, Ph.D., CRE, CAIA, of Fordham University, the model is similar to that used for the NAIOP Industrial Space Demand Forecast, which successfully projected a drop and rebound in net absorption of industrial space in 2009 and 2010. (The industrial space demand model was created by Guirguis along with Randy Anderson, Ph.D., then at the University of Central Florida.) Below are the leading, coincident and lagging variables used in the office space demand forecast.
- The growth rate in real gross domestic product captures the broadest level of macroeconomic activity, reflecting the value of all goods and services produced each year.
- Corporate profits of domestic industries directly capture the financial capacity and growth of firms that may need to expand. Profits are a source of retained earnings, so they indicate how much money is available to fund investments in plants and equipment, an investment activity that raises productive capacity.
- Total employment in the financial services sector is a direct measure and proxy for office-using employment that best fits with changes in office space demand.
- Two variables from the Institute for Supply Management’s Non-Manufacturing Indices serve as proxies for a sentiment measure on the future health of office-using firms. The ISM-NM Inventories Index measures increases and decreases in inventory levels, while the ISM-NM Supplier Deliveries Index measures how long it takes suppliers to deliver parts and materials that are integral to service-sector businesses.
- Core Personal Consumption Expenditures Price Index Inflation Rate (PCE Inflation).
These five measures make possible an accurate two-year forecast for nationwide net absorption of office space. The methods used in the forecast are dynamic rather than static to account for the changing nature of the underlying macroeconomy. Historical office real estate market data are provided by CoStar, which assumes no responsibility for this forecast. The dataset used for the forecast includes all office properties in the 390 largest U.S. markets tracked by CoStar, regardless of property size or owner occupancy status. Net absorption and other real estate market data identified in this report may vary compared to different datasets.
Authors
Hany Guirguis, Ph.D., Dean, O’Malley School of Business and Professor, Economics and Finance, Manhattan University
Joshua Harris, Ph.D., CRE, CAIA, Executive Director, Fordham Real Estate Institute, Fordham University
Media Inquiries
Please contact Kathryn Hamilton, CAE, vice president for marketing and communications, at hamilton@naiop.org.
1 Kastle Systems, “Kastle Back to Work Barometer,” November 5, 2025, https://www.kastle.com/safety-wellness/getting-america-back-to-work/.
2 Given the shutdown, the authors have omitted many references to government data that are normally included in this report and instead offer conjecture based on known facts.
3 “Preliminary Results for November 2025,” Surveys of Consumers, University of Michigan, November 7, 2025, https://www.sca.isr.umich.edu/.
* Research reports are complimentary to all audiences. Webinars are free for members and paid for nonmembers.
