


Office Space Demand Forecast, Fourth Quarter 2023
Release Date: November 2023
Slow Rebound in Office Space Demand Expected in 2024
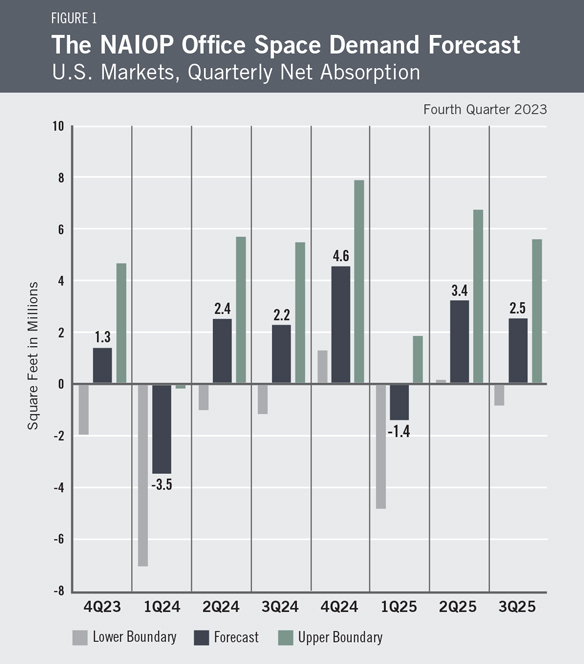
The office market continues to face stiff headwinds as office utilization has remained relatively flat over the last year, as evidenced by mobile-phone location data and building-access records.1 The U.S. economy has defied many economists’ forecasts for a recession in 2023, but office-using employment growth has stalled. Nonetheless, with a recession now appearing less likely, employment growth should continue next year, and firms may be more willing to commit to leasing space than they have been in 2023. Given these trends, net office-space absorption in 2024 is expected to be 5.7 million square feet. Moving forward, the forecast projects that net absorption will total approximately 4.5 million square feet during the first three quarters of 2025.
As office leases expire, tenants are trading space for quality, leasing smaller spaces in newer buildings with modern amenities to draw workers to the office. By contrast, the largest increases in vacancies since 2020 have been concentrated in a small proportion of the most functionally obsolete office buildings, which tend to be poorly located and poorly amenitized. Few of these buildings appear likely to remain in use as offices, barring significant renovation.2 In between the most and least attractive buildings, typical commodity office buildings face the prospect of continued high vacancy rates as higher interest rates depress property values. New construction has slowed, but given the lag between starting construction and delivering new office space, projects begun in earlier years continue to reach the market, with 17.1 million square feet delivered over the last two quarters. Combined with negative 12.3 million square feet of net absorption over the last two quarters, these completions have contributed to a rising national average vacancy rate, which reached 18.4% in the third quarter, the highest rate since 1992.3 Even if net absorption turns positive as currently forecast, vacancy rates will continue to rise so long as new completions exceed net absorption. Leasing conditions should start to improve once demand growth exceeds the delivery of new supply, which may not occur until 2025.
Economic Factors
The Federal Reserve’s continued efforts to quell inflation by raising interest rates at the expense of slowing economic growth seem to be having their desired effect. While real gross domestic product (GDP) did expand for the fifth straight quarter,4 the national unemployment rate crept up to 3.9%, the highest since January 20225 but below the natural rate of unemployment, which the Congressional Budget Office currently estimates to be about 4.4%.6 Office-using employment has risen 0.6% year-over-year but has flattened out in recent months.7 Inflation has been trending down since peaking in June 2022.8 However, should the Israeli-Palestinian conflict escalate into a broader regional conflict, rising energy prices could push inflation higher.
The Consumer Sentiment Index fell 5.3% in November and is now lower than it was in April.9 Disposable personal income has declined for three consecutive months.10 Student loan debt payments have resumed, which will likely constrain consumer spending, as will rising consumer debt levels. Slower consumer spending should translate to slower economic growth in the coming quarters.
The Forecast Model
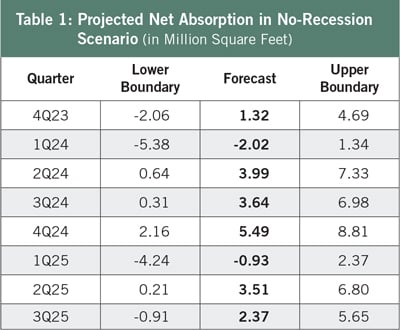
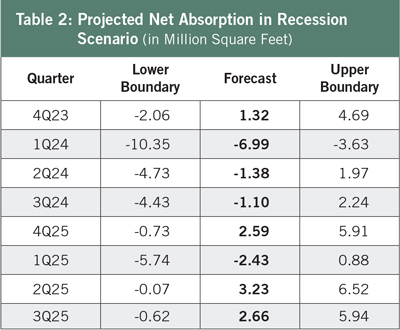
The model that informs this forecast draws from historical data on the economy and office real estate absorption to project future demand. Recent trends in office absorption suggest office-sector performance will reflect economic conditions, as in past economic cycles, though the amount of office space occupied per worker is lower than it was before 2020. The baseline out-of-sample forecast is illustrated in Figure 1. To account for the possibility of a recession, the current forecast assumes there is a 30% chance of one occurring in the first half of 2024. If a recession does occur, actual net absorption is expected to be negative in 2024. If a recession does not occur, absorption will be higher than the current forecast.
Table 1 provides the expected range in net absorption if a recession does not occur in 2024. Figure 1 assigns these values a 70% weighting. Table 2 assumes that the economy experiences a recession in the first half of 2024.
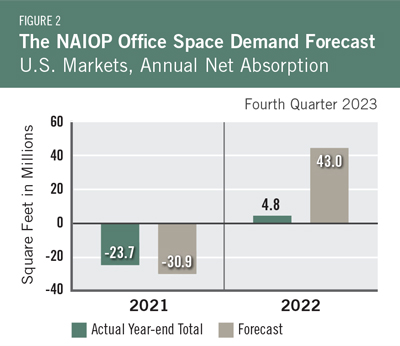
Actual Versus ForecastFigure 2 compares the forecast to actual net absorption. The forecast value tallies the most recent forecast data for each quarter of the year. The forecast for 2022 was 43.0 million square feet, which was 38.2 million square feet more than the 4.8 million square feet that were absorbed for the year. The forecast for 2021 was -30.9 million square feet, which is 7.2 million square feet less than the -23.7 million square feet that were absorbed for the year. |
 |
Key Inputs and Disclaimers
In January 2016, the NAIOP Research Foundation published “Forecasting Office Space Demand,” a model that forecasts net absorption of U.S. office space on a quarterly basis for eight consecutive quarters. Created by researchers Hany Guirguis, Ph.D., of Manhattan College, and Joshua Harris, Ph.D., CRE, CAIA, the model is similar to that used for the NAIOP Industrial Space Demand Forecast, which successfully projected a drop and rebound in net absorption of industrial space in 2009 and 2010. (The industrial space demand model was created by Guirguis along with Randy Anderson, Ph.D., then at the University of Central Florida.) Below are the leading, coincident and lagging variables used in the office space demand forecast.
- The growth rate in real gross domestic product (GDP) captures the broadest level of macroeconomic activity, reflecting the value of all goods and services produced each year.
- Corporate profits of domestic industries directly capture the financial capacity and growth of firms that may need to expand. Profits are a source of retained earnings, so they provide a clue about how much money is available to fund investments in plants and equipment, an investment activity that raises productive capacity.
- Total employment in the financial services sector is a direct measure and proxy for office-using employment that best fits with changes in office space demand.
- Two variables from the Institute for Supply Management’s Non-Manufacturing Indices serve as proxies for a sentiment measure on the future health of office-using firms. The ISM-NM Inventories Index measures increases and decreases in inventory levels, while the ISM-NM Supplier Deliveries Index measures how long it takes suppliers to deliver parts and materials that are integral to service-sector businesses.
- Core Personal Consumption Expenditures Inflation Rate (PCE Inflation).
These five measures make possible an accurate two-year forecast of net absorption of office space nationwide. The methods used in the forecast are dynamic rather than static, to account for the changing nature of the underlying macro economy.
Office absorption data are provided by CBRE Econometric Advisors, which assumes no responsibility for this forecast. The absorption forecast tracks with CBRE office data and may vary when compared to other datasets. Data include office buildings in the U.S. with a minimum rentable building area that ranges from 10,000 to 150,000 square feet, depending on the market. The current forecast is based on third-quarter 2023 data.
Authors
Hany Guirguis, Ph.D., Professor, Economics and Finance, Manhattan College
Michael J. Seiler, DBA, J.E. Zollinger Professor of Real Estate & Finance, College of William & Mary
Media Inquiries
Please contact Kathryn Hamilton, CAE, vice president for marketing and communications, at hamilton@naiop.org.
1 Lila Margalit, “Placer.ai Office Index: October 2023 Recap,” Placer.ai Blog, November 13, 2023, https://www.placer.ai/blog/placer-ai-office-index-october-2023-recap; Kastle Systems, “Kastle Back to Work Barometer,” November 13, 2023, https://www.kastle.com/safety-wellness/getting-america-back-to-work/.
2 Emil Malizia et al., “Hybrid Work and the Future of the Office: Adapting to a New Paradigm in Occupier Demand,” NAIOP Research Foundation, August 2023, https://www.naiop.org/research-and-publications/research-reports/reports/hybrid-work-and-the-future-of-office/.
3 Data from CBRE.
4 Bureau of Economic Analysis, “Gross Domestic Product, Third Quarter 2023 (Advance Estimate),” news release, October 26, 2023, https://www.bea.gov/news/2023/gross-domestic-product-third-quarter-2023-advance-estimate.
5 U.S. Bureau of Labor Statistics, “Employment Situation Summary,” news release, November 3, 2023, https://www.bls.gov/news.release/empsit.nr0.htm.
6 “Noncyclical Rate of Unemployment,” FRED Economic Data, Federal Reserve Bank of St. Louis, https://fred.stlouisfed.org/series/NROU.
7 Moody’s Analytics, “United States – Employment: Office using employment,” https://www.economy.com/united-states/employment-office-using-employment.
8 U.S. Bureau of Labor Statistics, “12-month percentage change, Consumer Price Index, Selected categories,” https://www.bls.gov/charts/consumer-price-index/consumer-price-index-by-category-line-chart.htm.
9 University of Michigan, “Surveys of Consumers: Preliminary Results for November 2023,” http://www.sca.isr.umich.edu/.
10 Bureau of Economic Analysis, “Personal Income and Outlays, September 2023,” news release, October 27, 2023, https://www.bea.gov/news/2023/personal-income-and-outlays-september-2023.
* Research reports are complimentary to all audiences. Webinars are free for members and paid for nonmembers.
