


Office Space Demand Forecast, Fourth Quarter 2022
Release Date: November 2022
Absorption Will Continue to Slow into 2023 Amid Economic Uncertainty
 The national office market absorbed 6.6 million square feet during the second and third quarters of 2022, but the vacancy rate continued its climb to 17.1%, the highest level since the third quarter of 1993.1 The completion of new office space outpaced absorption. A deeper look into the numbers reveals an appetite specifically for high-quality office buildings, which may support leasing activity in newly completed buildings despite continued weakness across the office sector. This flight to quality is most likely driven by tenant preferences for flexibility and the desire to attract and retain talent.
The mere threat of a recession has caused tenants to take a defensive posture and become more cautious when renewing leases, with many instead choosing to move to a smaller, newer and more flexible footprint. Moreover, the large supply of space available for sublease weakens rental rates and contributes to lower net absorption. The Bureau of Labor Statistics reported that there were 50,000 new office-using jobs added in September. But will these employees be coming into the office or working remotely? Many office-occupying firms prefer workers to be on-site, but after so many quarters of working remotely, it remains to be seen what percentage of employees will be willing to make a regular commute to the office and how much space will be needed to support hybrid work schedules. Of course, all this can change if the unemployment rate grows high enough that employers regain the upper hand.
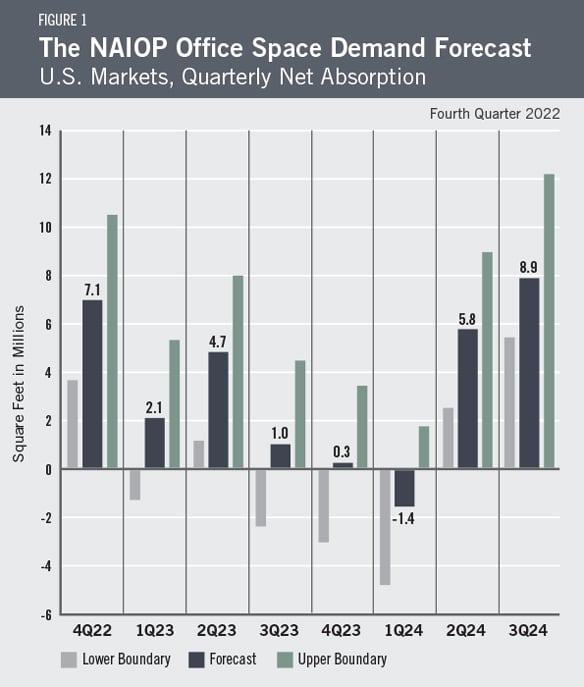
Given these trends and concerns about a potential recession in 2023, net office space absorption in the fourth quarter of 2022 is forecast to be 7.1 million square feet, with absorption in 2023 forecast to slow to 8.1 million square feet for the entire year. Moving forward, the forecast projects that absorption in the first three quarters of 2024 will total 13.3 million square feet (Figure 1).
Economic Factors
Inflation continues to be a key topic of debate. Although off its 40-year high of 9.1% in June, year-over-year inflation in October was still 7.7%,2 far exceeding the long-run target of roughly 2%.3 The greatest contributors to the Consumer Price Index (CPI) in October were shelter, gasoline and food. Declining costs for natural gas, used cars and trucks, apparel and medical care tempered the pace of overall inflation. To combat continued inflation, the Federal Reserve once again raised rates by 75 basis points at its November meeting to quell consumer spending and pump the brakes on economic growth.
After two quarters of decline, GDP grew 2.6% in the third quarter of 2022.4 Personal income increased by 0.4% in September, but personal consumption expenditures increased by 0.6%, resulting in a reduction in the savings rate.5 Real average hourly earnings declined 0.1% in September when factoring in both a 0.3% increase in nominal hourly earnings and a 0.4% increase in the CPI for all urban consumers.6 The national unemployment rate rose from 3.5% to 3.7% in October, still far below the natural rate of unemployment, and the number of unemployed increased by 306,000.7
In sum, it appears the Federal Reserve is taking the necessary steps to tame inflation, and signs are emerging that the labor market has begun to cool. Although low unemployment and continued growth in consumer spending suggest that the economy has not yet entered a recession, concerns are growing that rising interest rates will lead to one next year. For example, more than 60% of economists in surveys recently conducted by the National Association for Business Economics and the Wall Street Journal believe the U.S. will enter a recession within the next 12 months.8
The Forecast Model
The model that informs this forecast draws from historical data on the economy and office real estate absorption to project future demand. Recent trends in office absorption suggest office-sector performance will reflect economic conditions, as in past economic cycles. To account for the increasing likelihood of a recession, the current forecast assumes there is a 60% chance of one in 2023. This baseline forecast is illustrated in Figure 1. If a recession does occur, actual net absorption is expected to turn negative in 2023. If a recession does not occur, absorption will be higher than the current forecast.
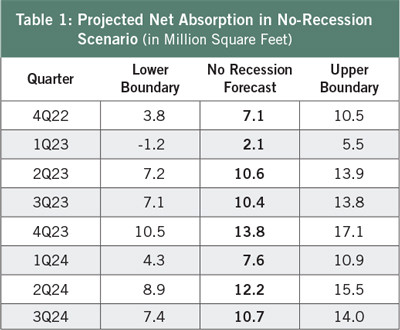
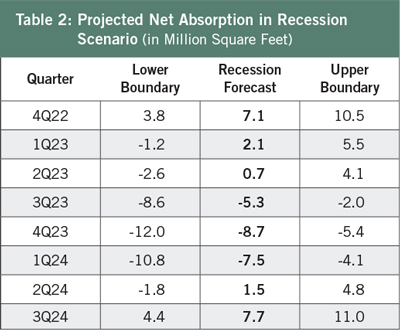
Table 1 provides the expected range in net absorption if a recession does not occur in 2023. Figure 1 assigns these values a 40% weighting. Table 2 assumes that the economy experiences a recession beginning in the second quarter of 2023, based on an analysis of the inverted yield curve and Conference Board Leading Economic Indicators.9 Figure 1 assigns these values a 60% weighting.
|
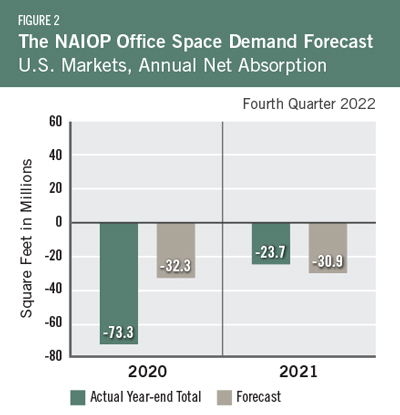
Actual Versus ForecastFigure 2 compares the forecast to actual net absorption. The forecast value tallies the most recent forecast data for each quarter in the year. The forecast for 2021 was -30.9 million square feet, which is 7.2 million square feet less than the -23.7 million square feet that were absorbed for the year. The forecast for 2020 was -32.3 million square feet, which is 41 million square feet less than the -73.3 million square feet that were absorbed for the year. Three quarters of the 2020 forecast data were published in the last quarter of 2019 and the second quarter of 2020, before the length of the pandemic or the magnitude of its effect on the economy were apparent. |
Key Inputs and Disclaimers
In January 2016, the NAIOP Research Foundation published “Forecasting Office Space Demand,” a model that forecasts net absorption of U.S. office space on a quarterly basis for eight consecutive quarters. Created by researchers Hany Guirguis, Ph.D., of Manhattan College, and Joshua Harris, Ph.D., CRE, CAIA, the model is similar to that used for the NAIOP Industrial Space Demand Forecast, which successfully projected a drop and rebound in net absorption of industrial space in 2009 and 2010. (The industrial space demand model was created by Guirguis along with Randy Anderson, Ph.D., then at the University of Central Florida.) Below are the leading, coincident and lagging variables used in the office space demand forecast.
- The growth rate in real gross domestic product (GDP) captures the broadest level of macroeconomic activity, reflecting the value of all goods and services produced each year.
- Corporate profits of domestic industries directly capture the financial capacity and growth of firms that may need to expand. Profits are a source of retained earnings, so they provide a clue about how much money is available to fund investments in plants and equipment, an investment activity that raises productive capacity.
- Total employment in the financial services sector is a direct measure and proxy for office-using employment that best fits with changes in office space demand.
- Two variables from the Institute for Supply Management’s Non-Manufacturing Indices serve as proxies for a sentiment measure on the future health of office-using firms. The ISM-NM Inventories Index measures increases and decreases in inventory levels, while the ISM-NM Supplier Deliveries Index measures how long it takes suppliers to deliver parts and materials that are integral to service-sector businesses.
- Core Personal Consumption Inflation Rate (PCE Inflation).
These four measures make possible an accurate two-year forecast of net absorption of office space nationwide. The methods used in the forecast are dynamic rather than static, to account for the changing nature of the underlying macro economy.
Office absorption data are provided by CBRE Econometric Advisors, which assumes no responsibility for this forecast. The absorption forecast tracks with CBRE office data and may vary when compared to other datasets. Data include office buildings in the U.S. with a minimum rentable building area that ranges from 10,000 to 150,000 square feet, depending on the market. The current forecast is based on third-quarter 2022 data.
Authors
Hany Guirguis, Ph.D., Professor, Economics and Finance, Manhattan College
Michael J. Seiler, DBA, J.E. Zollinger Professor of Real Estate & Finance, College of William & Mary
Media Inquiries
Please contact Kathryn Hamilton, CAE, vice president for marketing and communications, at hamilton@naiop.org.
* Office Space Demand Forecasts are complimentary to all audiences. Webinars are free for members and paid for nonmembers.
1 CBRE, “Q3 New Supply Outstrips Office Demand,” October 27, 2022, https://www.cbre.com/insights/figures/q3-2022-us-office-figures.
2 U.S. Bureau of Labor Statistics, “Consumer Price Index Summary,” news release, November 10, 2022, https://www.bls.gov/news.release/cpi.nr0.htm.
3 Mike Winters, “The Fed Announces 4th Consecutive Interest Rate Hike of 75 Basis Points—Here Are 4 Things That Will Be More Expensive,” CNBC, November 2, 2022, https://www.cnbc.com/2022/11/02/fed-raises-borrowing-costs-with-another-jumbo-interest-rate-hike.html.
4 Bureau of Economic Analysis, “Gross Domestic Product, Third Quarter 2022 (Advance Estimate),” news release, October 27, 2022, https://www.bea.gov/data/gdp/gross-domestic-product.
5 Bureau of Economic Analysis, “Personal Income and Outlays, September 2022” news release, October 28, 2022, https://www.bea.gov/news/2022/personal-income-and-outlays-september-2022.
6 U.S. Bureau of Labor Statistics, “Real Earnings Summary,” news release, October 13, 2022, https://www.bls.gov/news.release/realer.nr0.htm.
7 U.S. Bureau of Labor Statistics, “The Employment Situation—October 2022,” news release, November 4, 2022, https://www.bls.gov/news.release/pdf/empsit.pdf.
8 National Association for Business Economics, “Business Conditions Survey,” October 2022, https://nabe.com/NABE/Surveys/Business_Conditions_Surveys/October-2022-Business-Conditions-Survey-Summary.aspx; Harriet Torry and Anthony DeBarros, “Economists Now Expect a Recession, Job Losses by Next Year,” The Wall Street Journal, October 16, 2022, https://www.wsj.com/articles/economists-now-expect-a-recession-job-losses-by-next-year-11665859869?mod=article_inline.
9 The Conference Board, “US Leading Indicators,” news release, October 20, 2022, https://www.conference-board.org/topics/us-leading-indicators.
