


Office Space Demand Forecast, Second Quarter 2025
Release Date: May 2025
Demand for Office Space Expected to Grow Amid Economic Uncertainty
The national market for office space continued to rebound with a fourth consecutive quarter of positive net absorption. First-quarter absorption totaled 5.6 million square feet, which followed 7.3 million square feet absorbed in the fourth quarter of 2024. The nationwide vacancy rate remained at 11.8%. Rates of remote and hybrid work have plateaued, and the corresponding structural shift in office demand is already largely reflected in current leasing. Employers in several industries also appear to be requiring that employees spend more time at the office, resulting in a gradual increase in office use. On the other hand, potentially disruptive changes to U.S. trade policy and growing concern about federal debt levels have dimmed the outlook for economic growth and increased the risk of a recession while simultaneously contributing to higher long-term interest rates. However, with unemployment and inflation both at low levels, a recession is not a foregone conclusion, and a mild recession would not be expected to have a major effect on net absorption of office space. Given these trends, net office space absorption over the last three quarters of 2025 is expected to be 24.9 million square feet. Moving forward, the forecast projects that net absorption for 2026 will total approximately 15.1 million square feet. The current forecast is based on a conservative outlook for the economy that assumes a 70% chance of a mild recession.
The Office Market
Despite positive net absorption in the last three quarters of 2024, absorption for the full year was negative 14.4 million square feet due to sharply negative absorption in the first quarter (negative 30.0 million square feet). However, the consistently positive net absorption since that time may signal the end of the post-pandemic doldrums in office demand. The four-quarter rolling average of 3.6 million square feet of positive absorption remains much lower than the 22.9-millionsquare- foot quarterly average from 2010 through 2019. The current forecast projects that absorption will peak at just under half that level (11.2 million square feet) over the next eight quarters. With employment growth expected to be much slower than in the 2010s, net absorption in the coming decade is likely to be lower than the pre-pandemic average. Total employment from 2023 to 2033 is projected to grow by 6.7 million jobs, about a third as many jobs as were gained from 2009 to 2019 (19.8 million).1
It increasingly appears that the contraction in office space utilization in response to the adoption of remote work following the pandemic has largely ended as employers require more frequent office attendance. Office-building access records suggest a continued but very gradual increase in office utilization, reflected in consistent year-over-year growth since 2023.2 However, until all the long-term leases signed before March 2020 expire or are renewed, structural downsizing will remain a negative drag on net absorption. On the other hand, after several years of downsizing, some occupiers may find they do not have the space they need to attract and retain talent should the economy enter a period of strong and sustained growth. An unexpected economic boom would result in higher absorption than is projected in the current forecast.
Economic Factors
The recent increases in U.S. tariff rates and retaliatory measures by other nations has disrupted the outlook for the U.S. economy. Although effective tariffs are not currently as high as they briefly were in early April, their final scope, size and duration remain unclear, as do their effects on the economy. Adding to this uncertainty are growing concerns about U.S. federal debt levels, which have resulted in higher long-term interest rates. Unsurprisingly, The Conference Board Leading Economic Index has fallen but does not yet signal a recession.3 Trailing measures of employment and consumer spending have shown continued growth.4 Gross domestic product (GDP) shrank at an annual rate of 0.3% in the first quarter, but the contraction was driven by a large increase in imports as firms braced for an expected increase in tariffs.5 Netting out the impact of trade, GDP would have been positive.
On the upside, inflation has been trending toward the Federal Reserve’s 2% goal (notwithstanding any potential future tariff impacts), with recent readings of the Consumer Price Index (CPI) and Producer Price Index (PPI) coming in at 2.3% and 2.4% year over year, respectively.6 However, with unemployment low (currently 4.2%), growing concern about fiscal deficits, and the possibility that tariffs will contribute to higher inflation, interest rates—especially at the long end of the yield curve—could remain at current or even elevated levels for the foreseeable future. As such, the outlook for the U.S. economy and its effects on demand for office space are uncertain.
The Forecast Model
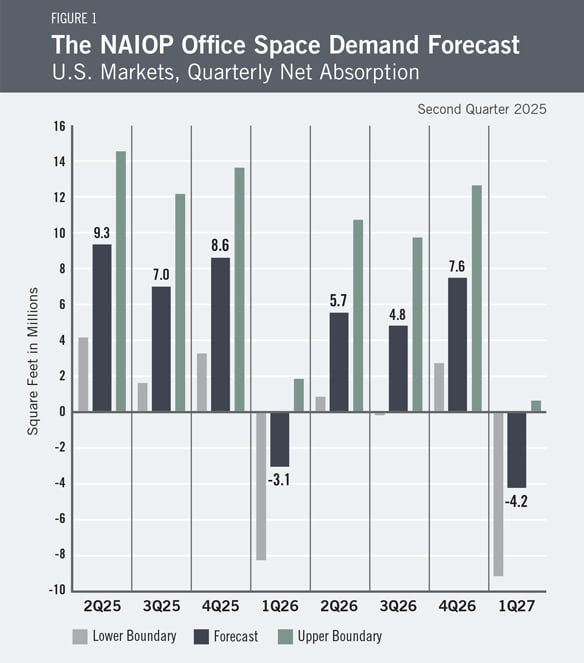
The model that informs this forecast draws from historical data on the economy and office real estate absorption to project future demand. Recent trends in office absorption suggest office sector performance will reflect economic conditions, as in past economic cycles, although the amount of office space occupied per worker is lower than it was before 2020. The baseline out-of-sample forecast is illustrated in Figure 1. The current forecast assumes there is a 70% chance that the U.S. economy entered a mild recession in the first quarter of 2025. If a recession does occur, actual net absorption is expected to be lower. If a recession does not occur, absorption will be higher than the current forecast.
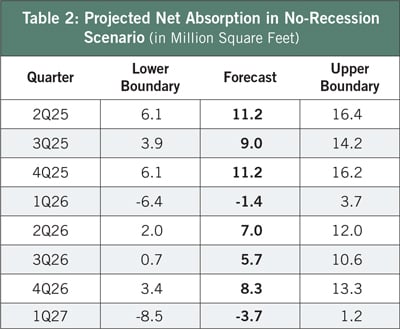
Table 1 provides the expected range in net absorption, assuming a recession began in the first quarter. Figure 1 assigns these values a 70% weighting. Table 2 assumes that the economy does not enter a recession.
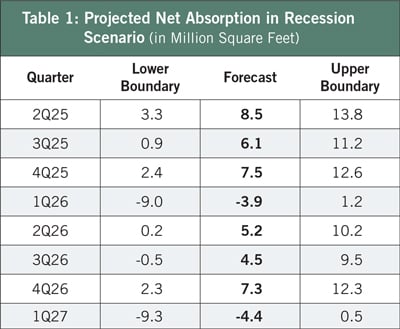
An analysis of the inverted yield curve, The Conference Board Leading Economic Index, and registered negative GDP growth in the first quarter of 2025 suggests that the U.S. may have entered a recession (reflected in Table 1). In that scenario, net absorption in the next four quarters (from the second quarter of 2025 to the first quarter of 2026) would total approximately 18.2 million square feet. Net absorption would then slow over the remaining four quarters to total 12.6 million square feet. This table is based on the possibility of a relatively mild recession. A sharper recession caused by a severe trade war, geopolitical crisis or other black swan event would be expected to result in lower or negative absorption.
If no recession occurs, the forecast projects that net absorption would total 30.0 million square feet between the second quarter of 2025 and the first quarter of 2026. Absorption would then slow to a total of 17.4 million square feet between the second quarter of 2026 and the first quarter of 2027.
Actual Versus Forecast
Since the Office Space Demand Forecast switched to using data from CoStar with the fourth-quarter report, the current report offers the first opportunity to measure the forecast’s performance using the new data. The previous report forecast that total net absorption across the fourth quarter of 2024 and the first quarter of 2025 would be 4.8 million square feet; actual net absorption over this period totaled 12.9 million square feet.
Key Inputs and Disclaimers
In January 2016, the NAIOP Research Foundation published “Forecasting Office Space Demand,” a model that forecasts net absorption of U.S. office space on a quarterly basis for eight consecutive quarters. Created by researchers Hany Guirguis, Ph.D., of Manhattan University, and Joshua Harris, Ph.D., CRE, CAIA, of Fordham University, the model is similar to that used for the NAIOP Industrial Space Demand Forecast, which successfully projected a drop and rebound in net absorption of industrial space in 2009 and 2010. (The industrial space demand model was created by Guirguis along with Randy Anderson, Ph.D., then at the University of Central Florida.) Below are the leading, coincident and lagging variables used in the office space demand forecast.
- The growth rate in real GDP captures the broadest level of macroeconomic activity, reflecting the value of all goods and services produced each year.
- Corporate profits of domestic industries directly capture the financial capacity and growth of firms that may need to expand. Profits are a source of retained earnings, so they provide a clue about how much money is available to fund investments in plants and equipment, an investment activity that raises productive capacity.
- Total employment in the financial services sector is a direct measure and proxy for office-using employment that best fits with changes in office space demand.
- Two variables from the Institute for Supply Management’s Non-Manufacturing Indices serve as proxies for a sentiment measure on the future health of office-using firms. The ISM-NM Inventories Index measures increases and decreases in inventory levels, while the ISM-NM Supplier Deliveries Index measures how long it takes suppliers to deliver parts and materials that are integral to servicesector businesses.
- Core Personal Consumption Expenditures Price Index Inflation Rate (PCE Inflation).
These five measures make possible an accurate two-year forecast for net absorption of office space nationwide. The methods used in the forecast are dynamic rather than static to account for the changing nature of the underlying macroeconomy. Historical office real estate market data are provided by CoStar, which assumes no responsibility for this forecast. The dataset used for the forecast includes all office properties in the 390 largest U.S. markets tracked by CoStar, regardless of property size or owner occupancy status. Net absorption and other real estate market data identified in this report may vary when compared with other datasets.
Authors
Hany Guirguis, Ph.D., Dean, O’Malley School of Business and Professor, Economics and Finance, Manhattan University
Joshua Harris, Ph.D., CRE, CAIA, Executive Director, Fordham Real Estate Institute, Fordham University
Media Inquiries
Please contact Kathryn Hamilton, CAE, vice president for marketing and communications, at hamilton@naiop.org.
1 U.S. Bureau of Labor Statistics, “Industry and occupational employment projections overview and highlights, 2023-33,” Monthly Labor Review, November 2024, https://www.bls.gov/opub/mlr/2024/article/industry-and-occupational-employment-projections-overview-and-highlights-2023-33.htm.
2 Kastle Systems, “Kastle Back to Work Barometer,” May 19, 2025, https://www.kastle.com/safety-wellness/getting-america-back-to-work/.
3 The Conference Board, “The Conference Board Leading Economic Index (LEI) for the US Plunged in April,” news release, May 19, 2025, https://www.conference-board.org/topics/us-leading-indicators.
4 U.S. Bureau of Labor Statistics, “Employment Situation Summary,” news release, May 2, 2025, https://www.bls.gov/news.release/empsit.nr0.htm; U.S. Census Bureau, “Advance Monthly Sales for Retail and Food Services,” news release, May 15, 2025, https://www.census.gov/retail/sales.html.
5 Bureau of Economic Analysis, “Gross Domestic Product, 1st Quarter 2025 (Advance Estimate),” news release, April 30, 2025, https://www.bea.gov/news/2025/gross-domestic-product-1st-quarter-2025-advance-estimate.
6 U.S. Bureau of Labor Statistics, “Consumer Price Index Summary,” news release, May 13, 2025, https://www.bls.gov/news.release/cpi.toc.htm; U.S. Bureau of Labor Statistics, “Producer Price Index News Release Summary,” news release, May 15, 2025, https://www.bls.gov/news.release/ppi.nr0.htm.
* Research reports are complimentary to all audiences. Webinars are free for members and paid for nonmembers.
