


Office Space Demand Forecast, Second Quarter 2023
Release Date: June 2023
Demand for Office Space Expected to Shrink Through Early 2024
 The national office market experienced total negative net absorption of 21.3 million square feet through the fourth quarter of 2022 and the first quarter of 2023, bringing the vacancy rate to 17.8 percent, the highest level since the second quarter of 1993.1 The COVID-19 public health emergency officially ended in the United States on May 11, 2023, but remote and hybrid work arrangements remain largely in place and continue to negatively affect demand for office space.
A currently strong labor market is combining with fears of a looming recession to limit occupiers’ interest in signing new leases. With the unemployment rate at 3.4 percent,2 the lowest since 1969, the competition for talent is supporting the continuation of hybrid and remote work policies. Although a gradually growing share of employers are requiring employees to come into the office four or five days a week, three days remains the norm in many office-using industries, and a minority of employers require fewer days in the office or allow a large share of their employees to be fully remote. Average office occupancy across the 10 metropolitan markets tracked by Kastle Systems remains at only 49.9 percent.3 At the same time, few firms are interested in expanding the amount of space they lease as they prepare for a potential recession later this year. As a result, while office-using employment has risen to 5.4 percent above pre-pandemic levels, occupied office space is 3.5 percent below pre-pandemic levels, and the average amount of office space per employee has fallen to a 22-year low of 152 square feet.4
A recent study by CBRE has found that 80 percent of the total increase in vacancy between the beginning of 2020 and the end of 2022 has been concentrated in only 10 percent of office buildings, suggesting that the functional obsolescence of a relatively small share of buildings is also contributing to higher vacancy rates.5 Until these buildings are retrofitted, repurposed or demolished, a surplus of obsolete space will likely pose a headwind for the broader office market. High interest rates have slowed office deal volumes and will likely limit the number of retrofit and conversion projects this year.
It remains to be seen how an actual recession might reshape the dynamic around hybrid and remote work. In the short term, however, a recession would weaken demand for office space. Weakness in the tech sector, for example, has led to layoffs, further suppressing demand for office space in several metro areas and contributing to an increase in the availability of subleased space, with technology firms now accounting for 23 percent of all sublease availability.6
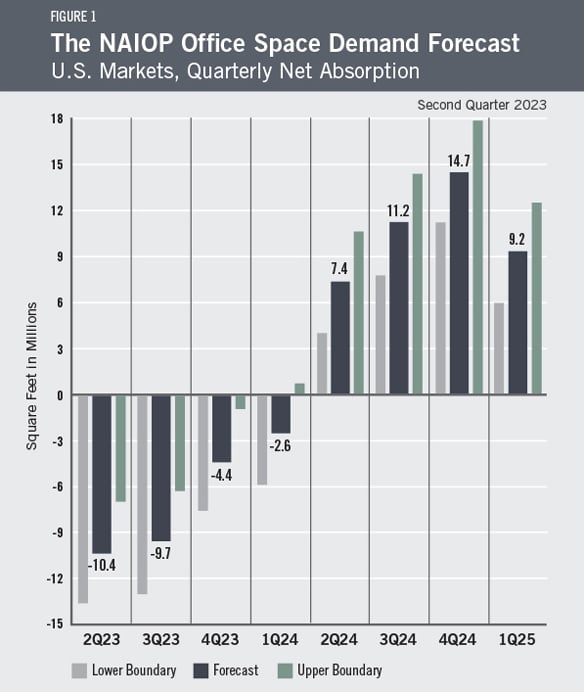
Given these trends, net office space absorption in the remaining three quarters of 2023 is expected to be negative 24.4 million square feet. Moving forward, the forecast projects that net absorption will turn positive in 2024 and will total approximately 30.6 million square feet for the year (Figure 1).
Economic Factors
Economic growth slowed to 1.1 percent in the first quarter of 2023, down from 2.6 percent in the fourth quarter of 2022.7 Year-over-year inflation, at 4.9 percent in April 2023, is trending in the right direction, although prices were 0.4 percent higher than in March.8 The previously noted record-low unemployment rate has helped keep the economy afloat despite continued interest rate increases by the Federal Reserve.
Real disposable personal income rose in the first quarter by 3.4 percent, meaning individuals have slightly more discretionary funds to make purchases.9 The Consumer Sentiment Index rose 2.4 percent in April to 63.5 percent, though it remained 2.6 percent lower than in April 2022.10 Continued uncertainty about the economy among consumers and businesses is likely to limit their expenditures, contributing to slower economic growth.
The Forecast Model
The model that informs this forecast draws from historical data on the economy and office real estate absorption to project future demand. Recent trends in office absorption suggest office-sector performance will reflect economic conditions, as in past economic cycles. To account for the possibility of a recession, the current forecast assumes there is a 60 percent chance of one occurring in the second half of 2023. This baseline out-of-sample forecast is illustrated in Figure 1. If a recession does occur, actual net absorption is expected to turn more sharply negative in 2023. If a recession does not occur, absorption will be higher than the current forecast.
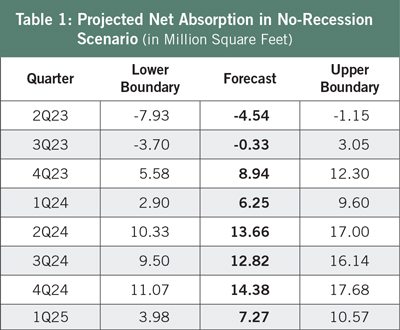
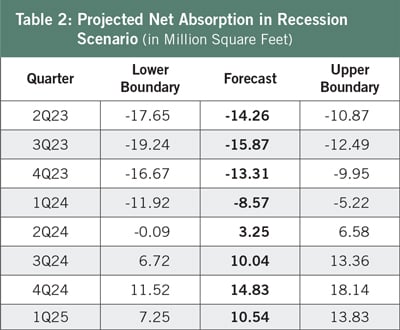
Table 1 provides the expected range in net absorption if a recession does not occur in 2023. Figure 1 assigns these values a 40 percent weighting. Table 2 assumes that the economy experiences a recession beginning in the second quarter of 2023, based on an analysis of the inverted yield curve and Conference Board Leading Economic Indicators.11 Figure 1 assigns these values a 60 percent weighting.
|
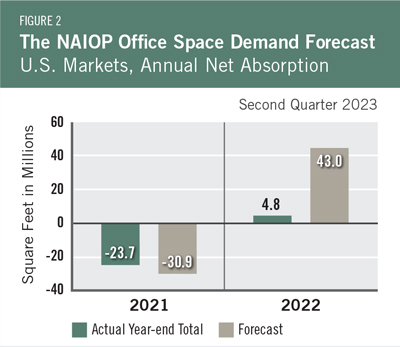
Actual Versus ForecastFigure 2 compares the forecast to actual net absorption. The forecast value tallies the most recent forecast data for each quarter in the year. The forecast for 2022 was 43.0 million square feet, which was 38.2 million square feet more than the 4.8 million square feet absorbed for the year. The forecast for 2021 was -30.9 million square feet, which is 7.2 million square feet less than the -23.7 million square feet absorbed for the year. |
Key Inputs and Disclaimers
In January 2016, the NAIOP Research Foundation published “Forecasting Office Space Demand,” a model that forecasts net absorption of U.S. office space on a quarterly basis for eight consecutive quarters. Created by researchers Hany Guirguis, Ph.D., of Manhattan College, and Joshua Harris, Ph.D., CRE, CAIA, the model is similar to that used for the NAIOP Industrial Space Demand Forecast, which successfully projected a drop and rebound in net absorption of industrial space in 2009 and 2010. (The industrial space demand model was created by Guirguis along with Randy Anderson, Ph.D., then at the University of Central Florida.) Below are the leading, coincident and lagging variables used in the office space demand forecast.
- The growth rate in real gross domestic product (GDP) captures the broadest level of macroeconomic activity, reflecting the value of all goods and services produced each year.
- Corporate profits of domestic industries directly capture the financial capacity and growth of firms that may need to expand. Profits are a source of retained earnings, so they provide a clue about how much money is available to fund investments in plants and equipment, an investment activity that raises productive capacity.
- Total employment in the financial services sector is a direct measure and proxy for office-using employment that best fits with changes in office space demand.
- Two variables from the Institute for Supply Management’s Non-Manufacturing Indices serve as proxies for a sentiment measure on the future health of office-using firms. The ISM-NM Inventories Index measures increases and decreases in inventory levels, while the ISM-NM Supplier Deliveries Index measures how long it takes suppliers to deliver parts and materials that are integral to service-sector businesses.
- Core Personal Consumption Inflation Rate (PCE Inflation).
These four measures make possible an accurate two-year forecast of net absorption of office space nationwide. The methods used in the forecast are dynamic rather than static, to account for the changing nature of the underlying macro economy.
Office absorption data are provided by CBRE Econometric Advisors, which assumes no responsibility for this forecast. The absorption forecast tracks with CBRE office data and may vary when compared to other datasets. Data include office buildings in the U.S. with a minimum rentable building area that ranges from 10,000 to 150,000 square feet, depending on the market. The current forecast is based on first-quarter 2023 data.
Authors
Hany Guirguis, Ph.D., Professor, Economics and Finance, Manhattan College
Michael J. Seiler, DBA, J.E. Zollinger Professor of Real Estate & Finance, College of William & Mary
Media Inquiries
Please contact Kathryn Hamilton, CAE, vice president for marketing and communications, at hamilton@naiop.org.
* Office Space Demand Forecasts are complimentary to all audiences. Webinars are free for members and paid for nonmembers.
1 CBRE, Market Fundamentals data as of Q1 2023.
2 U.S. Bureau of Labor Statistics, “Employment Situation Summary,” news release, May 5, 2023, https://www.bls.gov/news.release/empsit.nr0.htm.
3 Kastle Systems, “Kastle Back to Work Barometer,” May 8, 2023, https://www.kastle.com/safety-wellness/getting-america-back-to-work/.
4 CBRE, “Disconnect Emerges Between Office Job Growth & Office Demand,” March 15, 2023, https://www.cbre.com/insights/briefs/disconnect-emerges-between-office-job-growth-and-office-demand.
5 CBRE, “Office Buildings Hardest Hit by Pandemic Share Common Characteristics,” April 4, 2023, https://www.cbre.com/insights/viewpoints/office-buildings-hardest-hit-by-pandemic-share-common-characteristics.
6 CBRE, “U.S. Office Sublease Availability Nearly Doubles Since Pandemic,” April 20, 2023, https://www.cbre.com/insights/briefs/us-office-sublease-availability-nearly-doubles-since-pandemic.
7 Bureau of Economic Analysis, “Gross Domestic Product, First Quarter 2023 (Advance Estimate),” news release, April 27, 2023, https://www.bea.gov/data/gdp/gross-domestic-product.
8 U.S. Bureau of Labor Statistics, “Consumer Price Index Summary,” news release, May 10, 2023, https://www.bls.gov/news.release/cpi.nr0.htm.
9 Bureau of Economic Analysis, “Gross Domestic Product.”
10 University of Michigan, “Surveys of Consumers: Final Results for April 2023,” http://www.sca.isr.umich.edu/.
11 The Conference Board, “US Leading Indicators,” news release, April 20, 2023, https://www.conference-board.org/topics/us-leading-indicators.
* Research reports are complimentary to all audiences. Webinars are free for members and paid for nonmembers.
