


Office Space Demand Forecast, Second Quarter 2022
Release Date: May 2022
Class A Buildings Lead the Stabilization of the Office Market
The U.S. office market absorbed 21.6 million square feet across the last quarter of 2021 and the first quarter of 2022. Office market vacancy rates increased for the 10th straight quarter to start the year, but a look inside the numbers reveals that the completion of new office product is partially responsible. Class A buildings are driving net absorption rates in many parts of the country, such as the Sun Belt, and firms consider quality office space necessary to attract skilled employees. Suburban markets and life sciences hubs are recovering better than the national average as more employers embrace a return to the office and the pandemic eases. According to Kastle Systems data on office utilization, office occupancy across the 10 U.S. cities that the company tracks reached 43.4% on April 27, a new record since the pandemic began.1
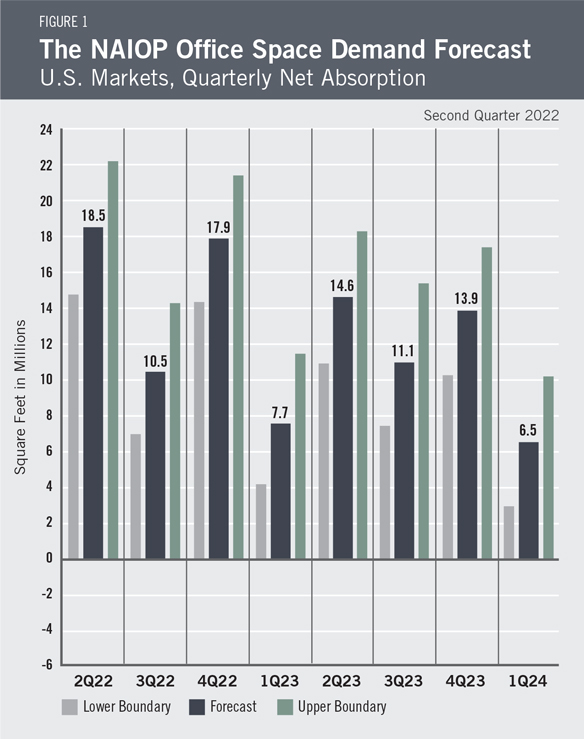
Leasing activity is up compared with the same period last year, which signals that firms are more comfortable making longer-term commitments to office space. Property owners have been willing to offer greater tenant improvements to encourage signing, indicating that tenants still have the upper hand in lease negotiations. These signals indicate a move toward a more stable equilibrium as the office market finds its balance. Given these trends and signs of a slowing—but still growing—economy, net office space absorption in the remaining three quarters of 2022 is forecast to be 46.9 million square feet, essentially unchanged from the previous forecast for these quarters (46.6 million square feet). Total net absorption in 2023 is forecast to be 47.3 million square feet, with an additional 6.5 million square feet absorbed in the first quarter of 2024 (Figure 1).
Economic Trends
Inflation continues to be a significant concern in the economy as the Consumer Price Index saw yet another increase in March, up 1.2% from February and an 8.5% increase year-over-year. Energy remains the largest contributor to inflation, but Core CPI—which excludes energy and food prices—rose 6.5% year-over-year, its highest rate since 1982.2 Despite recent inflation, consumers continue to spend, with real personal consumption expenditures increasing 0.2% in March.3 GDP declined in the first quarter of 2022 by a seasonally adjusted 1.4%, but that decline was primarily due to an increase in the trade deficit and a small decline in inventories.4 Both factors can be attributed to the continued disruption of global supply chains as many shipments that would have arrived in the prior quarter were delayed at U.S. ports.5 Consumer spending rose at a 2.7% annual rate over the quarter and business spending grew 9.2%, suggesting that the recent negative growth rate will be transitory.
The unemployment rate is at a staggeringly low 3.6%, far below the natural rate of unemployment. Nonfarm payroll employment grew by 428,000 jobs in April. That total included 88,000 jobs added in the largest office-using industries: financial activities, professional and business services, and information.6 Continued employment growth in these industries should support office leasing activity in coming months.
While wage rates increased by 0.4% in March, the 1.2% increase in the cost of goods sold translated into a 0.8% reduction in purchasing power.7 Declining real wages have the potential to slow future consumer spending. The Federal Reserve continues to raise interest rates to slow inflation, which should dampen economic growth in coming quarters. Until inflation comes under control, expect to see slowing economic growth, at least in real terms.
The Forecast Model
The model that informs this forecast draws from historical data on the economy and office real estate absorption to project future demand. Recent trends in office absorption suggest that office-sector performance will reflect economic conditions, as in past economic cycles. This forecast assumes a slowdown in the growth rate of real GDP for 2022 and 2023. Real GDP is expected to expand by only 2.8% in 2022 and 2.2% in 2023, with an unemployment rate of 3.5% in 2022 and 2023. The forecast also assumes that the office absorption rate will be below what it would usually be in a similar macroeconomic environment. The current labor shortage and workers’ preference for remote or hybrid work arrangements will continue to impact future demand for offices.
|
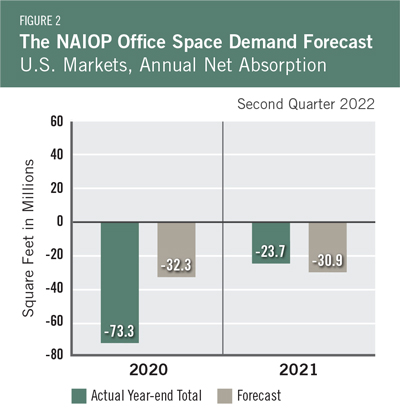
Actual Versus ForecastFigure 2 compares the forecast to actual net absorption. The forecast value tallies the most recent forecast data for each quarter in the year. The forecast for 2021 was -30.9 million square feet, which is 7.2 million square feet less than the -23.7 million square feet that were absorbed for the year. The forecast for 2020 was -32.3 million square feet, which is 41 million square feet more than the -73.3 million square feet that were absorbed for the year. Three quarters of the 2020 forecast data were published in the last quarter of 2019 and the second quarter of 2020, before the length of the pandemic or the magnitude of its effect on the economy were apparent. |
Key Inputs and Disclaimers
In January 2016, the NAIOP Research Foundation published “Forecasting Office Space Demand,” a model that forecasts net absorption of U.S. office space on a quarterly basis for eight consecutive quarters. Created by researchers Hany Guirguis, Ph.D., of Manhattan College, and Joshua Harris, Ph.D., CRE, CAIA, the model is similar to that used for the NAIOP Industrial Space Demand Forecast, which successfully projected a drop and rebound in net absorption of industrial space in 2009 and 2010. (The industrial space demand model was created by Guirguis along with Randy Anderson, Ph.D., then at the University of Central Florida.) Below are the leading, coincident and lagging variables used in the office space demand forecast.
- The growth rate in real gross domestic product (GDP) captures the broadest level of macroeconomic activity, reflecting the value of all goods and services produced each year.
- Corporate profits of domestic industries directly capture the financial capacity and growth of firms that may need to expand. Profits are a source of retained earnings, so they provide a clue about how much money is available to fund investments in plants and equipment, an investment activity that raises productive capacity.
- Total employment in the financial services sector is a direct measure and proxy for office-using employment that best fits with changes in office space demand.
- Two variables from the Institute for Supply Management’s Non-Manufacturing Indices serve as proxies for a sentiment measure on the future health of office-using firms. The ISM-NM Inventories Index measures increases and decreases in inventory levels, while the ISM-NM Supplier Deliveries Index measures how long it takes suppliers to deliver parts and materials that are integral to service-sector businesses.
- Core Personal Consumption Inflation Rate (PCE Inflation).
These four measures make possible an accurate two-year forecast of net absorption of office space nationwide. The methods used in the forecast are dynamic rather than static, to account for the changing nature of the underlying macro economy.
Office absorption data are provided by CBRE Econometric Advisors, which assumes no responsibility for this forecast. The absorption forecast tracks with CBRE office data and may vary when compared to other datasets. Data include office buildings in the U.S. with a minimum rentable building area that ranges from 10,000 to 150,000 square feet, depending on the market. The current forecast is based on first-quarter 2022 data.
Authors
Hany Guirguis, Ph.D., Professor, Economics and Finance, Manhattan College
Michael J. Seiler, DBA, J.E. Zollinger Professor of Real Estate & Finance, College of William & Mary
Media Inquiries
Please contact Kathryn Hamilton, CAE, vice president for marketing and communications, at hamilton@naiop.org.
* Office Space Demand Forecasts are complimentary to all audiences. Webinars are free for members and paid for nonmembers.
1 “Kastle Back to Work Barometer,” Kastle Systems, May 2, 2022, https://www.kastle.com/safety-wellness/getting-america-back-to-work/.
2 U.S. Bureau of Labor Statistics, “Consumer Price Index Summary,” news release, April 12, 2022, https://www.bls.gov/news.release/cpi.nr0.htm.
3 Bureau of Economic Analysis, “Personal Income and Outlays, March 2022,” news release, April 29, 2022, https://www.bea.gov/sites/default/files/2022-04/pi0322.pdf.
4 Bureau of Economic Analysis, “Gross Domestic Product, First Quarter 2022 (Advance Estimate),” news release, April 28, 2022, https://www.bea.gov/sites/default/files/2022-04/gdp1q22_adv.pdf.
5 Justin Lahart, “The GDP Mirage,” The Wall Street Journal, April 28, 2022, https://www.wsj.com/articles/the-gdp-mirage-11651160035.
6 U.S. Bureau of Labor Statistics, “The Employment Situation—April 2022,” news release, May 6, 2022, https://www.bls.gov/news.release/pdf/empsit.pdf.
7 U.S. Bureau of Labor Statistics, “Real Earnings Summary,” news release, April 12, 2022, https://www.bls.gov/news.release/realer.nr0.htm.
