The NAIOP Market Monitor
Release Date: July 2025
Executive Summary

The NAIOP Market Monitor provides insights into shifting market conditions and capital flows across the United States. The report’s findings can help investors and developers identify regional trends and identify markets that align with their risk and return objectives or warrant further examination.
The 2025 NAIOP Market Monitor identifies a resurgence of sales activity in office markets that likely reflects investors acting on the stabilization in overall demand for office space. It also reveals strong growth in investment activity in industrial real estate despite a slowdown in industrial leasing fundamentals across the U.S. Notable findings include:
- Transaction volume in the largest 51 office and industrial markets grew faster than in the second-largest 51 markets for each property type over the last year, but the rate of growth since 2019 remains higher for the second-largest 51 office and industrial markets.
- Office markets in Southeastern states attracted a growing share of office transaction volume.
- Relative office transaction volume fell in several northern and inland markets in California but ticked up in the state’s southern coastal markets.
- Several industrial markets underwent large changes in volatility, and there was a notable increase in the number of industrial markets that experienced a substantial swing in volume.
- Relative volatility declined across several industrial markets in the Pacific and Mountain West and in the Southeast but rose in several Midwestern markets.
- Relative transaction volume declined across several industrial markets in the Pacific and Mountain West.
About the NAIOP Market Monitor
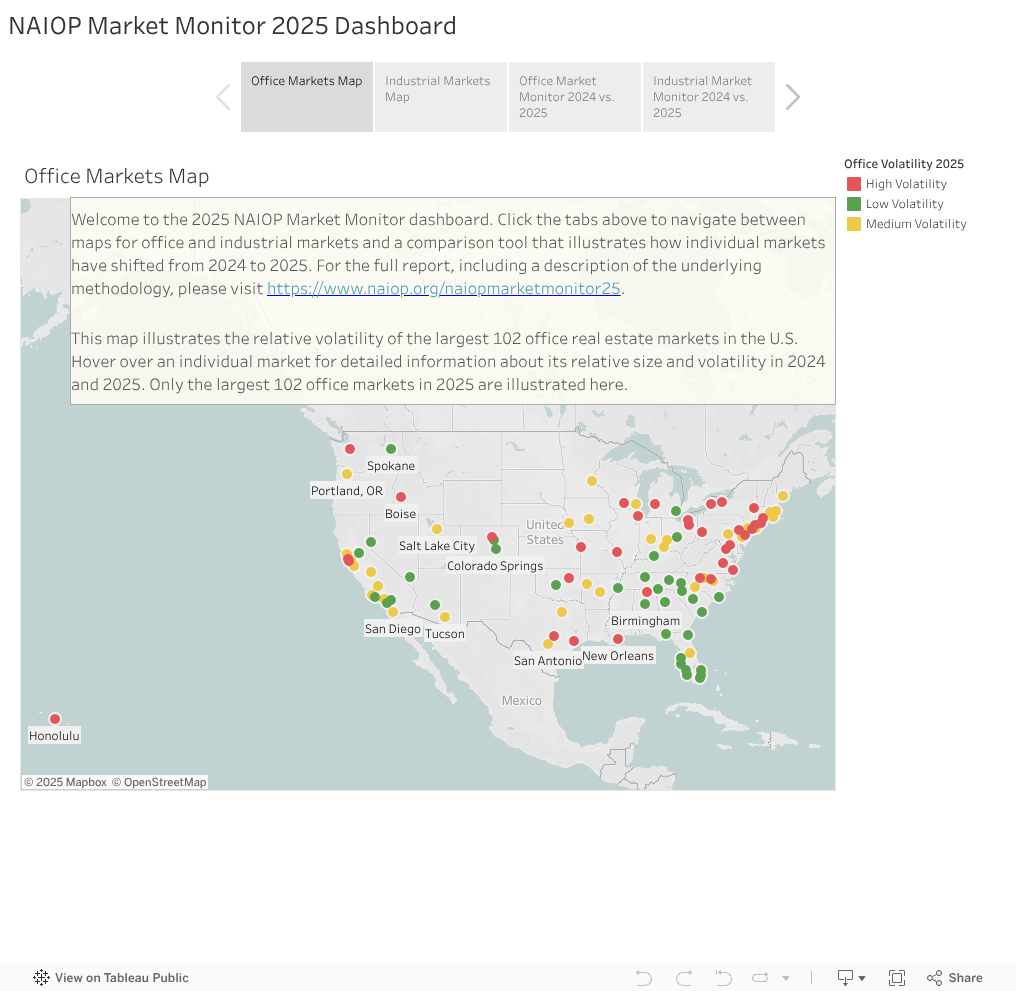
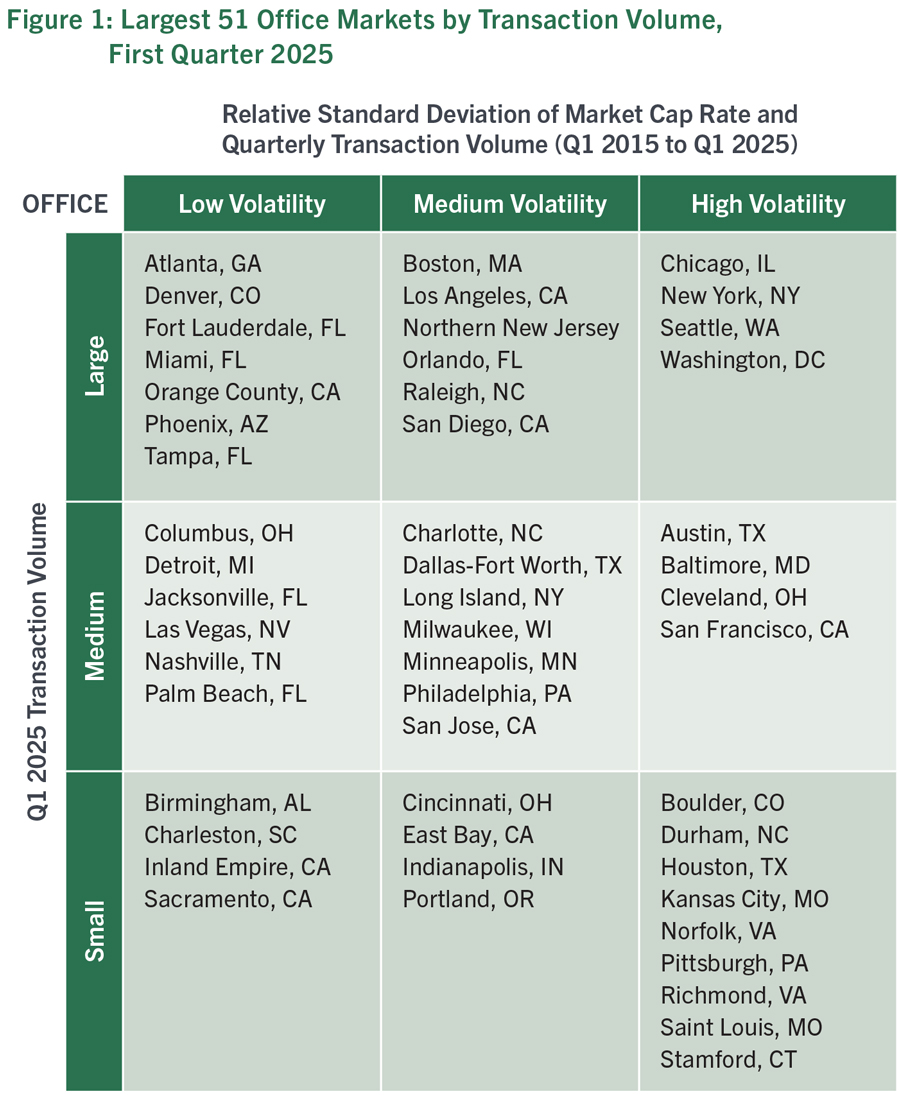
Each year, the NAIOP Market Monitor examines data provided by CoStar to describe the relative size (transaction volume) and volatility (variance in transaction volume and capitalization rates) of the largest 102 office and industrial markets in the U.S. This report looks at data from the first quarter of 2025 and identifies notable changes since the first quarter of 2024. The 2024 edition performed the same analysis based on data from the first quarter of 2024. Office and industrial markets are each segmented into the largest 51 and second-largest 51 markets by transaction volume and arranged on a two-dimensional grid with volume on the Y-axis and volatility on the X-axis. The results are displayed in Figures 1 and 2 for office markets and Figures 4 and 5 for industrial markets. Additional information about the methodology used to construct the NAIOP Market Monitor is included in the Methodology section at the end of this report. An interactive dashboard that accompanies this report visualizes changes over time for individual office and industrial markets and includes maps illustrating their relative volatility.
Office Markets
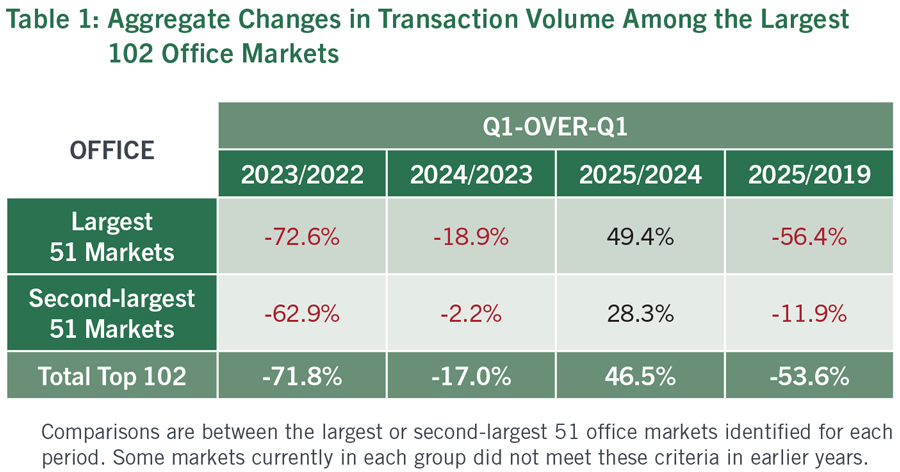
Total transaction volume among the second-largest 51 office markets has nearly recovered from pre-pandemic levels, down only 11.9% from the first quarter of 2019, but it remains depressed among the largest 51 office markets, with total volume down 56.4% over the same period. In contrast with the previous two editions of the NAIOP Market Monitor, office markets did not experience any large changes in volatility over the past year, despite strong growth in average transaction volumes. Instead, the most notable changes were in each market’s relative size when compared with others. With the sizable increase in activity among the largest 51 office markets, a few California markets that had briefly risen to the top third of the largest markets in 2023 (East San Francisco Bay Area, Sacramento, Inland Empire) fell to the bottom third of the group. As in past years, there were also several substantial changes in the relative size of the second-largest 51 office markets.
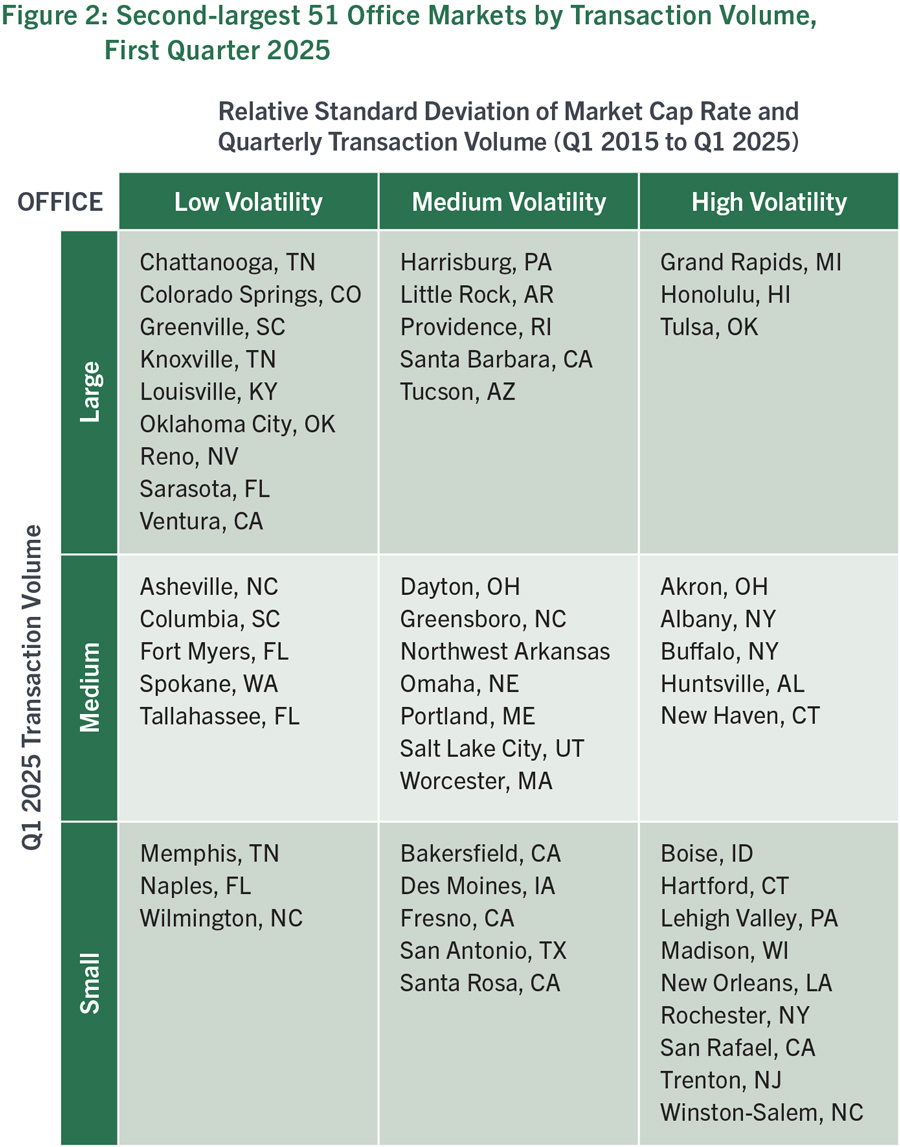
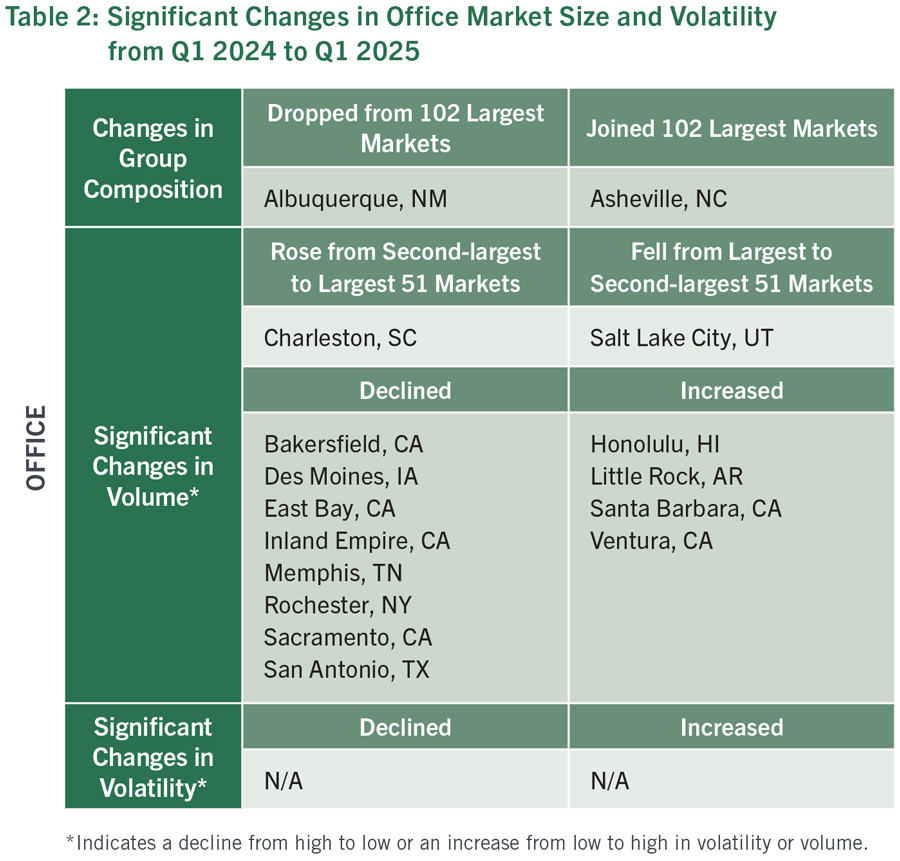
Nearly a third (33) of the top 102 office markets are located in the Southeastern states of Alabama, Arkansas, Florida, Georgia, Kentucky, Louisiana, North Carolina, South Carolina, Tennessee and Virginia.1 Of these, 18 experienced growth in relative transaction volume, while only four (Memphis, Fort Myers, Richmond and Winston-Salem) experienced a decline in relative transaction volume. Population inflows into the Southeast continue to translate into above-trend deal activity, with growth hubs in Georgia and Florida logging sales that outpace the broader market trends.
The decline in relative size of the East Bay, Sacramento and the Inland Empire was part of a larger shift within California away from several northern and inland office markets (San Jose, Santa Rosa, Fresno and Bakersfield also experienced smaller declines in relative size). That shift appears to have favored southern coastal markets in the state (Santa Barbara, Ventura and San Diego all experienced relative growth). There was no clear geographic pattern to changes in transaction volume in other Western states or in regions outside of the Southeast and California, nor was there a discernable regional pattern to changes in volatility.
In a number of secondary markets, year-over-year (YoY) changes in transaction volume were driven by a single large transaction or portfolio sale. For example, two big office towers in Fort Lauderdale drove the market’s volume increase. Conversely, Fort Myers’ volume dropped because its relative size in last year’s report was based on one large sale. This underscores that transaction volume metrics for smaller markets can be extremely volatile, as a major sale (more than $50 million) in one year can skew YoY comparisons. For this reason, the NAIOP Market Monitor sorts markets into the largest or second-largest 51 markets based on average transaction volume over 10 years.
Charleston rose from the second-largest group to the largest group of office markets. Albuquerque is no longer among the 102 largest office markets, replaced by Asheville. Asheville had previously fallen out of the top 102 office markets, but a single $7 million medical-office sale in Biltmore Park pushed it back into the second-largest 51 markets for this report.
1 None are located in Mississippi or West Virginia.
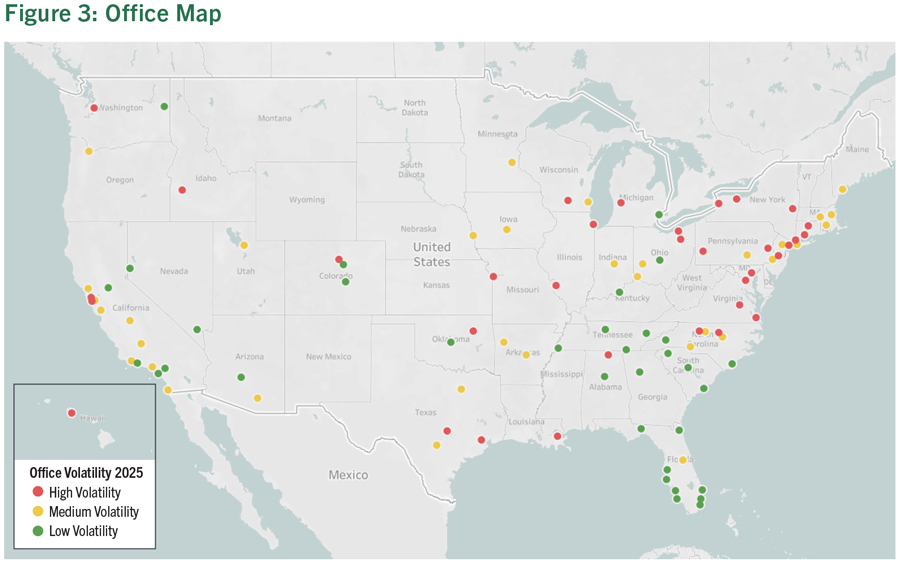
A map of the relative volatility among the 102 largest office markets. There was no discernable regional pattern to changes in relative volatility since the last report. Refer to the interactive dashboard for additional details on changes in volatility and transaction volume.
Industrial Markets
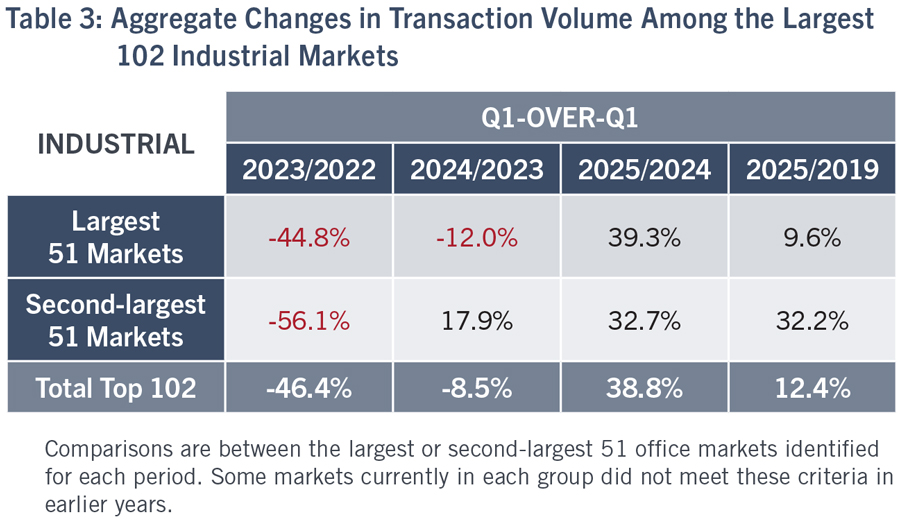
Compared with 2019, the second-largest 51 industrial markets have experienced faster long-term transaction volume growth (up 32.2%) than their larger peers (up only 9.6%) though the largest 51 markets grew faster over the last year. The strong growth in transaction volume across industrial markets was accompanied by an increase in the number of individual markets experiencing large changes in relative volatility or size as investors reallocated capital between markets. Across the full set of 102 markets, 12 experienced a large relative change in transaction volume, and four experienced a large relative change in volatility (compared with eight large changes in volume and one large change in volatility in last year’s report). Overall investment was concentrated in gateway port markets, inland hubs and large population centers, as has been the case in past years. A few growing port markets on the East Coast and Gulf Coast (Norfolk, Savannah and Houston) saw increased relative transaction volume compared with last year, with Savannah reaching the top third of the largest 51 industrial markets for the first time since the NAIOP Market Monitor was created. It is too early for the available data to reflect potential disruption in investment trends due to the recent increase in tariff rates, although a resulting reduction in international trade could lead investors to shy away from port markets in the coming quarters.
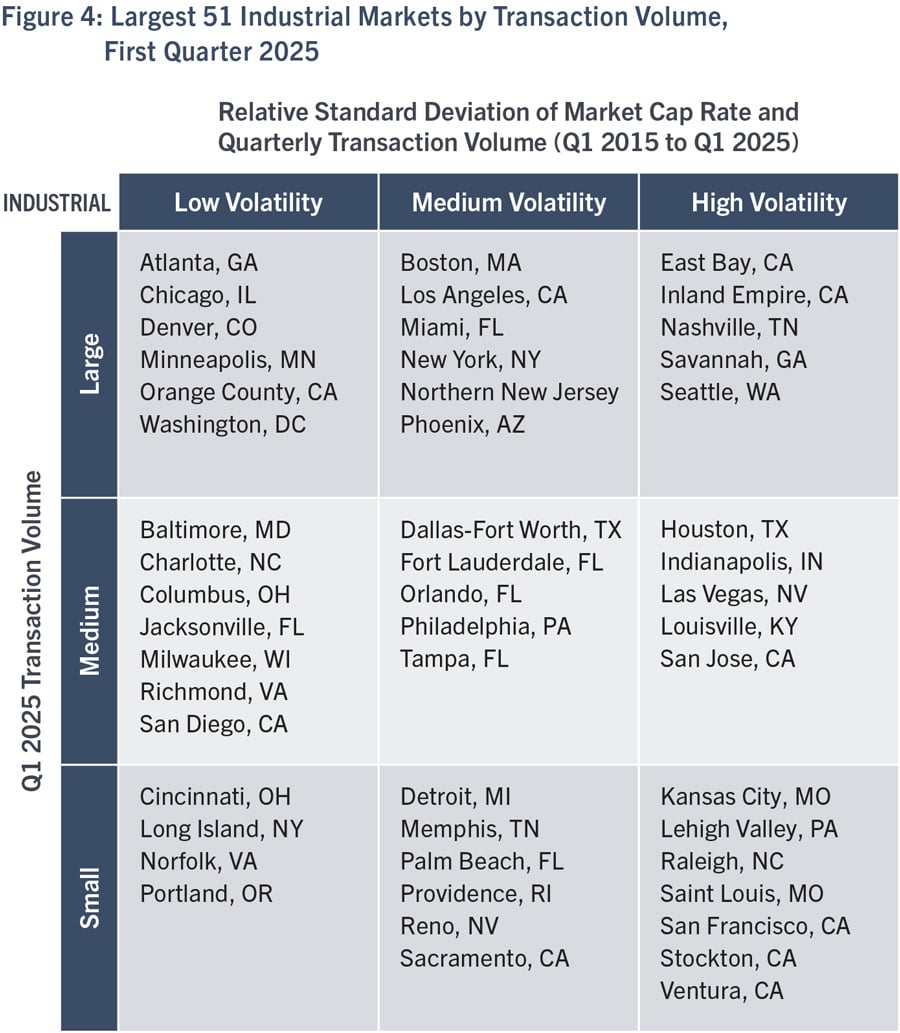

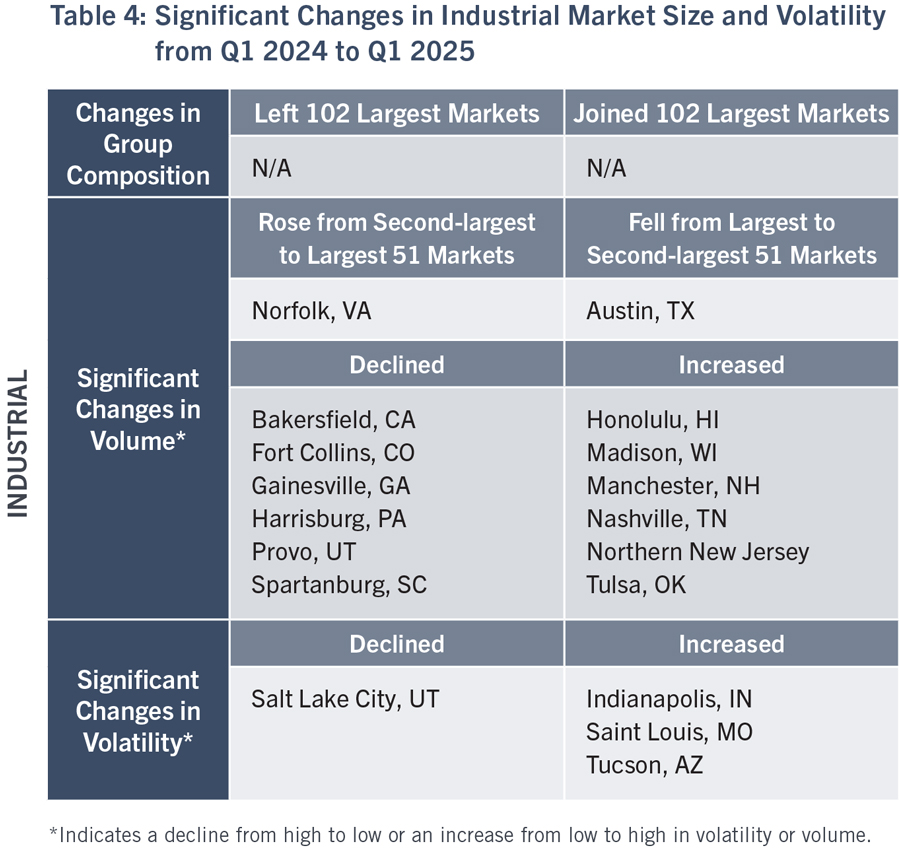
Among the 51 largest industrial markets, Northern New Jersey rose from the bottom third to the top third in relative size, as big-box transactions returned to the market in 2024. Prologis paid $197.4 million for two cross-dock facilities (600,000 square feet) in Monroe Township, and Bain Capital spent $208 million on an 11-building, 784,000-square-foot portfolio. Nashville also rose to the top of the largest 51 markets, driven by a single large acquisition and new institutional interest in the market.
Saint Louis and Indianapolis both experienced large increases in volatility, part of a broader pattern in Midwestern states. Sixteen of the 102 largest industrial markets are located in Illinois, Indiana, Iowa, Michigan, Minnesota, Missouri, Nebraska, Ohio and Wisconsin. Of these, seven experienced an increase in relative volatility, and none experienced a decline. By comparison, more markets experienced declining relative volatility than increasing volatility in the Southeast and the Pacific and Mountain West, with no clear pattern in volatility in other regions.
Aside from Northern New Jersey and Nashville, most large changes in relative size occurred in the second-largest 51 markets, which is consistent with the greater transaction volume volatility that is typical in smaller markets. Austin dropped from the largest to second-largest 51 industrial markets despite several portfolio acquisitions.
The only apparent regional pattern in volume was a decline in relative size across several markets in the Pacific and Mountain West. Of the 28 markets located in Arizona, California, Colorado, Nevada, Oregon, Utah and Washington, nine experienced a decline in relative transaction volume, while only two experienced an increase. A regional pattern of declining relative volatility and declining relative transaction volume reflect relative stability in Western markets and higher rates of growth (and resulting volatility) in other markets across the U.S.
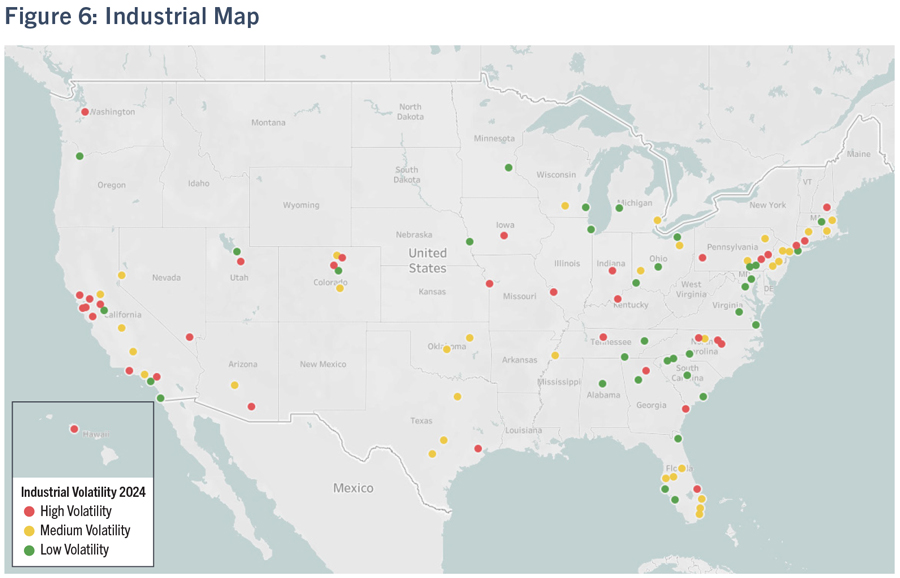
A map of the relative volatility among the 102 largest industrial markets. The only discernable geographic pattern in changes in volatility since the last report was a decrease in volatility in Western states. Refer to the interactive dashboard for additional details on changes in volatility and transaction volume.
Methodology
The NAIOP Market Monitor analyzes data on transaction volume and capitalization rates provided by CoStar. It takes the largest 102 office and industrial markets in the U.S. and sorts them into the largest 51 and next-largest 51 as measured by transaction volume in the most recent quarter. These markets are then arranged in two-dimensional three-by-three grids. The grid’s vertical axis sorts each set of 51 markets into top, middle and bottom thirds for transaction volume as a measurement of market size (large, medium and small). The grid’s horizontal axis sorts these markets by their volatility, measured as an equal weighting of the relative standard deviation of their respective capitalization (or “cap”) rates and the relative standard deviation of their respective quarterly transaction volume over a 10-year period. The bottom, middle and top third of markets are classified as “low volatility,” “medium volatility” and “high volatility.” Relative standard deviation was chosen as the best measurement of volatility, as it accounts for a market’s size (e.g., small changes in transaction volume are more significant in smaller markets) and average cap rate (a small change in cap rate has a greater effect on real values in a market that previously had a low cap rate than it does in a market that had a high cap rate). The resulting grids allow a user to simultaneously compare markets by size and volatility.
The relative volatility between the largest 51 and the next-largest 51 office and industrial markets can be compared on a percentage basis at a point in time. For the purposes of this report, the authors compared the indexed volatilities of each market type in the first quarter of 2025. Some markets are outliers from the group average, so readers should not directly compare volatility for individual markets that appear in the 51 largest office or industrial markets to those that appear in the second-largest 51 markets.
About NAIOP
NAIOP, the Commercial Real Estate Development Association, is the leading organization for developers, owners and related professionals in office, industrial, retail and mixed-use real estate. NAIOP comprises some 21,000 members in North America. NAIOP advances responsible commercial real estate development and advocates for effective public policy. For more information, visit naiop.org.
The NAIOP Research Foundation was established in 2000 as a 501(c)(3) organization to support the work of individuals and organizations engaged in real estate development, investment and operations. The Foundation’s core purpose is to provide information about how real properties, especially office, industrial and mixed-use properties, impact and benefit communities throughout North America. The initial funding for the Research Foundation was underwritten by NAIOP and its Founding Governors with an endowment established to support future research. For more information, visit naiop.org/researchfoundation.
About the Authors
Maria Sicola and Elle Saling have partnered on many data and analytics initiatives, including developing market forecasting models, global data warehousing databases, and benchmarking tools for leasing analysis using evolving data technologies and analytics to support decision-making and facilitate public discussion. Charles Warren is the senior quantitative lead for the Real Estate Analysis and Value Capture practice at WSP, focusing on leveraging transit-oriented development to increase funding for transit infrastructure. Sicola holds an MBA from Manhattan College, an MS in Information Science from Rutgers University, and a BA from Seton Hall University; additionally, she completed post-graduate studies in statistics and experimental design at Purdue University. Saling holds an Executive Management Certification from the UCLA Anderson School of Management and a BS in Business Administration from the California Polytechnic University at San Luis Obispo. Warren holds a PhD in City and Regional Planning from the University of California Berkeley and an MA in Urban Studies from the John W. Draper Interdisciplinary Program at New York University.
Media Inquiries
Please contact Kathryn Hamilton, vice president for marketing and communications, at hamilton@naiop.org.
Disclaimer
This project is intended to provide information and insights to industry practitioners and does not constitute advice or recommendations. NAIOP disclaims any liability for actions taken as a result of this project and its findings.
© 2025 NAIOP Research Foundation