


Industrial Space Demand Forecast, Third Quarter 2025
Release Date: August 2025
The U.S. market for industrial space continued to slow into the first half of 2025, with only 27.0 million square feet absorbed during this period, with demand shrinking by 11.3 million in the second quarter, the first negative quarterly reading since 2010. This decline was likely driven by increasing macroeconomic uncertainty caused by unclear tariff policies and persistently high interest rates. The authors expect that heightened uncertainty will likely persist at least through the rest of the year and lead to reduced leasing activity. Given this continued uncertainty and persistently high interest rates, the current NAIOP Industrial Space Demand Forecast projects that net absorption will be nearly flat over the second half of 2025 (2.8 million square feet).
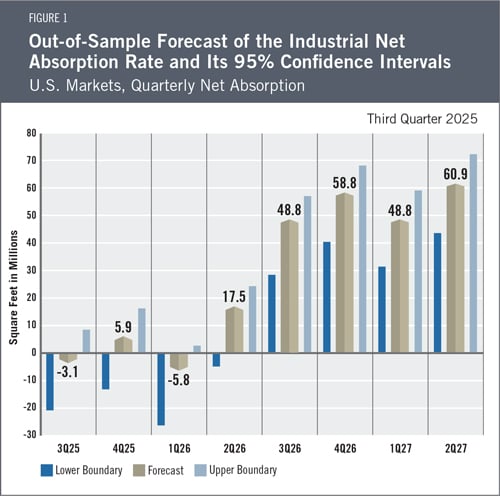
Demand for industrial space is expected to recover somewhat after occupiers have time to adjust to a new tariff regime. However, higher tariffs and slowing employment growth will likely result in slower demand growth than that experienced from 2020 to 2022 or in the six years that preceded the pandemic. Absorption is expected to rebound beginning in the second quarter of 2026, with full-year absorption totaling 119.3 million square feet. Another 109.7 million square feet of absorption is expected in the first half of 2027 (see Figure 1 for quarterly projections).
The Industrial Market
The health of the U.S. industrial market is now heavily influenced by macroeconomic conditions and U.S. trade policy, which could alter the competitive strategies of occupiers that import raw, intermediate and finished goods, as well as those that export products abroad. Large and frequent shifts in expected tariff rates have made it difficult for these occupiers to make long-term leasing decisions. Since earlier fears of an escalating trade conflict have largely abated following recent negotiations, it is possible some occupiers that had deferred leasing decisions will choose to move forward in the second half of the year. However, it remains a near certainty that overall tariff rates will remain higher for the foreseeable future. Many industrial space users will need to adapt to this reality when planning their current and future occupancy needs.
In the near term, the market for industrial space will likely continue to soften as new supply outstrips demand. According to CoStar, 194.6 million square feet of new space was delivered in the first half of the year, contributing to a 50-basis-point increase in the vacancy rate, to 6.7%. Roughly 466 million square feet of industrial space is currently under construction, down sharply from the billion square feet under construction at the end of 2022 and close to the size of the project pipeline in mid-2019. Vacancy rates may continue to rise for several more quarters until demand growth catches up with new deliveries. Until then, rental rates are likely to remain flat or even decline in some markets.
Economic Trends
Attempts by importers to get ahead of the expected tariff announcement in April produced some large swings in gross domestic product (GDP) in the first and second quarters of the year. A surge of imports and buildup of inventories led to negative 0.5% annualized growth in real GDP in the first quarter, while a corresponding decline in imports and inventories in the second quarter contributed to an annualized growth rate of 3%.1 Either averaging the two quarters results or reversing the effects of changes in net exports and inventories would result in an annualized real growth rate of around 1% to 1.5%, a slowdown from prior quarters.
Although equity markets are now largely looking past tariff policy uncertainty, modest job growth in July and large downward revisions to employment growth figures from May and June2 align with the recent decline in demand for industrial space and suggest that a broader slowdown in the economy is underway. It remains to be seen whether the slowdown in hiring is a temporary reaction to increased uncertainty around tariffs or indicative of a more significant downturn. The authors are wary of predicting a near-term recession, especially given the resilience of the economy over the last three years despite recurring warning signs in leading indicators.
The Federal Reserve has not adjusted interest rates this year, and long-term rates have remained relatively stable. Consumer price inflation remains at 2.7% year over year, which is within 30 basis points of where it has been for the past 12 months.3 Forward expectations are for the Federal Reserve to cut the federal funds rate by the end of 2025, especially if the employment market remains soft. Falling rates and greater clarity on tariffs could reduce uncertainty and spur greater demand for industrial space, leading to a return to positive absorption in early 2026.
The Forecast Model
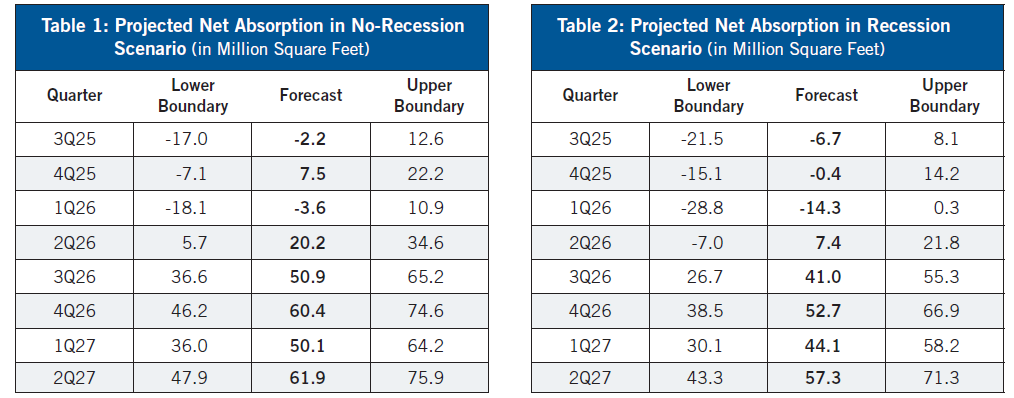
The authors use various explanatory drivers in the forecast's statistical model, such as lagged net absorption, real GDP growth, inflation and output gaps, monetary policy, and seasonal and structural effects. They rely on data from CoStar as the primary source for the national industrial market; historical data from CoStar were used to apply an exponential smoothing technique to eliminate seasonality. To account for the possibility of a recession, the current forecast assumes there is a 21% chance of one occurring in 2025. This baseline out-of-sample forecast is illustrated in Figure 1. If a recession does occur, actual net absorption is expected to turn more sharply negative in 2025. If a recession does not occur, absorption will be higher than the current forecast.
Table 1 provides the expected range in net absorption if a recession does not occur in 2025. Figure 1 assigns these values a 79% weighting. Table 2 assumes the economy experiences a recession beginning in the third quarter of 2025, based on an analysis of the yield curve for U.S. Treasurys, the Chauvet-Piger Model and the Wall Street Journal Economic Forecasting Survey. Figure 1 assigns these values a 21% weighting.
The forecast for industrial absorption in the second half of 2025 is 2.8 million square feet, with lower and upper boundaries of -34 and 24.9 million square feet, respectively. The predicted full-year net absorption for 2026 is 119.3 million square feet, with lower and upper boundaries of 37.9 and 152.7 million square feet, respectively. The forecast for industrial absorption in the first half of 2027 is 109.7 million square feet, with lower and upper boundaries of 75.5 and 131.6 million square feet, respectively. By comparison, full-year net absorption was million square feet in 2021, 627 million square feet in 2022, 297.4 million square feet in 2023, and 203.1 million square feet in 2024.
Actual Versus Forecast
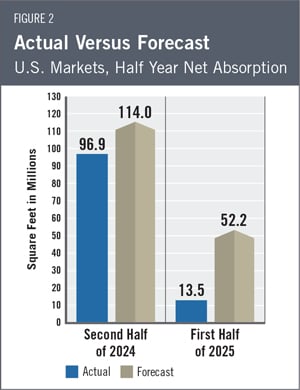
Figure 2 compares actual net absorption in the first half of 2025 to what the first-quarter forecast had projected. The first year-over-year evaluation of the forecast will be provided when full-year data are available for 2025. During the first half of 2025, 27.0 million square feet of industrial space was absorbed, compared with the forecast 130 of 52.2 million square feet.
Key Inputs and Disclaimers
The predictive model is funded by the NAIOP Research Foundation and was developed by Hany Guirguis, Ph.D., and Randy Anderson, Ph.D., formerly of the University of Central Florida. The model, which forecasts demand for industrial space at the national level, utilizes variables that comprise the entire supply chain and lead the demand for space, resulting in a model that can capture most changes in demand.
While leading economic indicators have been able to forecast recessions and expansions, the indices used in this study are constructed to forecast industrial real estate demand expansions, peaks, declines and troughs. The Industrial Space Demand model was developed using the Kalman filter approach, where the regression parameters are allowed to vary with time and thus are more appropriate for an unstable industrial real estate market.
The forecast is based on a process that involves testing more than 40 economic and real estate variables that theoretically relate to the demand for industrial space, including varying measures of employment, GDP, exports and imports, and air, rail and shipping data. Leading indicators that factor heavily into the model include the Federal Reserve Board's Index of Manufacturing Output (IMO), the Purchasing Managers Index (PMI) from the Institute of Supply Management (ISM), and historical net absorption data provided by CoStar. Historical industrial real estate market data are provided by CoStar, which assumes no responsibility for this forecast. The dataset used for the forecast includes all industrial and flex-industrial properties in the 390 largest U.S. markets tracked by CoStar, regardless of property size or owner occupancy status. Net absorption and other real estate market data identified in this report may vary when compared with other datasets.
Authors
Hany Guirguis, Ph.D., Dean of the O'Malley School of Business and Professor, Economics and Finance, Manhattan University
Joshua Harris, Ph.D., CRE, CAIA, Executive Director, Fordham Real Estate Institute, Fordham University
Media Inquiries
Please contact Kathryn Hamilton, vice president for marketing and communications, at hamilton@naiop.org.
1 Bureau of Economic Analysis, "Gross Domestic Product, 2nd Quarter 2025 (Advance Estimate)," news release, July 30, 2025, https://www.bea.gov/news/2025/gross-domestic-product-2nd-quarter-2025-advance-estimate.
2 U.S. Bureau of Labor Statistics, Employment Situation Summary, news release, August 1, 2025, https://www.bls.gov/news.release/empsit.nr0.htm.
3 U.S. Bureau of Labor Statistics, Consumer Price Index Summary, news release, August 12, 2025, https://www.bls.gov/news.release/cpi.nr0.htm.
* Research reports are complimentary to all audiences. Webinars are free for members and paid for nonmembers.
