


Industrial Space Demand Forecast, First Quarter 2026
Release Date: March 2026
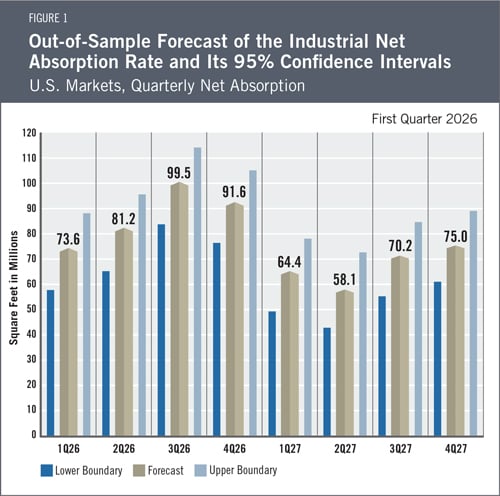
U.S. demand for industrial space strengthened in the second half of 2025, with net absorption of 128.7 million square feet. These gains followed a weak first half that included negative absorption in the second quarter of 2025, signaling that occupiers have begun to adjust to earlier disruptions in investment activity and trade policy. Greater clarity around interest rates and reduced concerns about tariff policy have helped improve the outlook for 2026. While political and economic risks remain elevated, the forecast anticipates steady improvement in leasing activity over the next two years. The NAIOP Industrial Space Demand Forecast projects that net absorption will continue to increase through the first half of 2026 to 154.8 million square feet and end the full year at 345.9 million square feet of absorption as economic conditions stabilize. This reflects expectations that businesses will increase their industrial space needs as they gain confidence in a more predictable operating environment. The forecast also projects 267.7 million square feet of absorption in 2027 (see Figure 1 for quarterly projections).
The Industrial Market
According to an analysis of historical data provided by CoStar, the volume of net square feet of industrial space delivered in 2025 exceeded net absorption by 220 million square feet, leading to the national vacancy rate increasing to 6.9% (from 6.2% at year-end 2024). Given the recent pace of deliveries and the current forecast for net absorption, vacancy rates may increase slightly this year. As a result, average rents are expected to remain flat across markets over the next few quarters. Changes in supply and demand are nonetheless significantly closer to balancing as the market stabilizes.
Demand for industrial real estate is being supported by continued growth in consumer spending and e-commerce. Retail sales excluding gasoline stations rose 4.2% annually in December.1 Online sales in the third quarter grew 5.1% year over year, and e-commerce’s share of total retail sales reached 16.4%, slightly above the 16.3% recorded a year earlier and the previous record high set in the second quarter of 2020.2 Growth in retail sales is also translating to growth in retailer and wholesaler inventories, albeit at a slower pace of only 1.3% year over year as of the third quarter.3 Although occupiers are clearly seeking to use inventory more efficiently than during the height of the pandemic, inventory growth is nonetheless a welcome sign for industrial building owners.
Growth in e-commerce sales also supports demand for more modern logistics and fulfillment space. Leasing by logistics, distribution and third-party logistics firms has risen, while the supply of suitable space remains limited as many occupiers seek to replace aging assets.4 This dynamic can support occupancy and rent growth for newer space, particularly in metro areas where the supply of modern logistics buildings is tight.
Economic Trends
Economic data reflect volatility early in the year, followed by a return to growth. After a contraction in the first quarter, real gross domestic product (GDP) increased at annual rates of 3.8% in the second quarter and 4.4% in the third quarter.5 The Federal Reserve Bank of Atlanta recently projected annualized growth of 3.6% for the fourth quarter of 2025,6 suggesting that growth may continue into 2026. Economic conditions in 2025 were shaped by several significant policy events. The Trump administration’s tariff actions created a period of uncertainty that corresponded with weaker investment and slower industrial leasing activity in the second quarter. As the year progressed, markets grew less concerned about the potential for disruptive outcomes from new trade policies. Later in the year, a 43-day federal government shutdown, the longest in U.S. history, delayed data releases and clouded the economic picture. Given this context, most recent economic data appear relatively positive, with continued GDP growth and the unemployment rate at 4.3%.7
However, consumer attitudes do not reflect this economic stability. The University of Michigan’s consumer sentiment index stood at 57.3 in February 2026, a decline of 11.4% from a year earlier despite a modest improvement from the prior month.8 Current sentiment readings are close to levels previously seen during the 2008 financial crisis. A widening gap between consumer perceptions and actual economic performance increases uncertainty when attempting to project future conditions. If a decline in consumer sentiment were to translate into a sharp pullback in household spending, it could lead to a rapid decline in demand for industrial space, particularly for facilities tied to the distribution of consumer goods. However, a divergence between consumer sentiment and economic fundamentals has persisted for several quarters without a significant decline in consumer spending.
Inflation pressures have eased but remain above the Federal Reserve’s long-term target. The core Consumer Price Index rose 0.3% in January 2026 and increased 2.5% over the past year.9 With core inflation still running above target, borrowing costs are unlikely to fall quickly, which could slow the pace of new commitments for industrial space. The Federal Reserve must now balance persistent inflation pressures with signs of labor market softening. While unemployment remains relatively low, hiring slowed to an average of 15,000 jobs per month in 2025, down from 168,000 in 2024, signaling a cooling labor market.10 Because employment conditions directly influence consumer spending, the future direction of employment will have important implications for industrial demand. If hiring weakens further or turns negative in 2026, consumer spending could contract more quickly than in past cycles, creating risks for industrial demand even as lower rates would support borrowing and investment.
The Forecast Model
The authors utilize various explanatory drivers in the forecast’s statistical model, such as lagged net absorption, real GDP growth, inflation and output gaps, monetary policy, and seasonal effects. Historical data from CoStar were used to apply an exponential smoothing technique to remove seasonality.
The full-year forecast for industrial absorption in 2026 is 345.9 million square feet, with lower and upper boundaries of 285.5 and 406.3 million square feet, respectively. The predicted full-year net absorption for 2027 is 267.7 million square feet, with lower and upper boundaries of 209.2 and 326.2 million square feet, respectively. By comparison, full-year net absorption was 630.7 million square feet in 2022, 293.0 million square feet in 2023, 211.6 million square feet in 2024, and 168.3 million square feet in 2025.
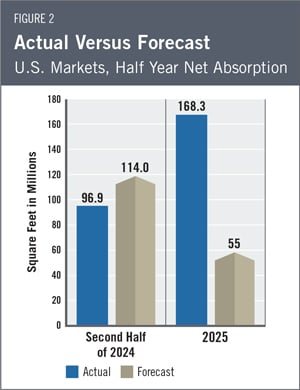
Actual Versus Forecast
Figure 2 compares actual net absorption in 2025 to what the forecast had projected for the year. In 2025, 168.3 million square feet of industrial space was absorbed, compared with the forecast of 55 million square feet.
Key Inputs and Disclaimers
The predictive model is funded by the NAIOP Research Foundation and was developed by Hany Guirguis, Ph.D., and Randy Anderson, Ph.D., formerly of the University of Central Florida. The model, which forecasts demand for industrial space at the national level, utilizes variables that comprise the entire supply chain and lead the demand for space, resulting in a model that can capture most changes in demand.
While leading economic indicators have been able to forecast recessions and expansions, the indices used in this study are constructed to forecast industrial real estate demand expansions, peaks, declines and troughs. The Industrial Space Demand model was developed using the Kalman filter approach, where the regression parameters are allowed to vary with time and thus are more appropriate for an unstable industrial real estate market.
The forecast is based on a process that involves testing more than 40 economic and real estate variables that theoretically relate to the demand for industrial space, including varying measures of employment, GDP, exports and imports, and air, rail and shipping data. Leading indicators that factor heavily into the model include the Federal Reserve Board’s Index of Manufacturing Output (IMO), the Purchasing Managers Index (PMI) from the Institute of Supply Management (ISM), and historical net absorption data provided by CoStar. Historical industrial real estate market data are provided by CoStar, which assumes no responsibility for this forecast. The dataset used for the forecast includes all industrial and flex-industrial properties in the 390 largest U.S. markets tracked by CoStar, regardless of property size or owner occupancy status. Net absorption and other real estate market data identified in this report may vary when compared with other datasets.
Authors
Hany Guirguis, Ph.D., Dean of the O’Malley School of Business and Professor, Economics and Finance, Manhattan University
Joshua Harris, Ph.D., CRE, CAIA, Academic Director, Fordham Real Estate Institute, Fordham University
Media Inquiries
Please contact Brielle Scott, director of marketing and communications, at scott@naiop.org.
1 U.S. Census Bureau, “Advance Monthly Sales for Retail and Food Service,” news release, February 10, 2026. https://www.census.gov/retail/sales.html.
2 U.S. Census Bureau, “Quarterly Retail E Commerce Sales,” news release, December 18, 2025. https://www.census.gov/retail/ecommerce.html.
3 U.S. Census Bureau, “Manufacturing and Trade Inventories and Sales: November 2025,” news release, February 10, 2026. https://www.census.gov/mtis/current/index.html.
4 JLL Research, “United States: Industrial Market Dynamics, Q4 2025,” news release, January 21, 2026. https://www.jll.com/en-us/insights/market-dynamics/industrial-market-statistics-trends.
5 U.S. Bureau of Economic Analysis, “Gross Domestic Product, 3rd Quarter 2025 (Updated Estimate), GDP by Industry, and Corporate Profits (Revised),” news release, January 22, 2026. https://www.bea.gov/news/2026/gross-domestic-product-3rd-quarter-2025-updated-estimate-gdp-industry-and-corporate.
6 Federal Reserve Bank of Atlanta, “GDPNow: Latest Estimate for 2025:Q4,” February 18, 2026. https://www.atlantafed.org/research-and-data/data/gdpnow.
7 U.S. Bureau of Labor Statistics, “The Employment Situation Summary - January 2026,” news release, February 11, 2026. https://www.bls.gov/news.release/empsit.nr0.htm.
8 University of Michigan, Survey Research Center. “Survey of Consumers: Preliminary Results for February 2026,” February 6, 2026. https://www.sca.isr.umich.edu/.
9 U.S. Bureau of Labor Statistics, “Consumer Price Index Summary: January 2026,” news release, February 13, 2026. https://www.bls.gov/news.release/cpi.nr0.htm.
10 U.S. Bureau of Labor Statistics, “The Employment Situation Summary.”
