


Industrial Space Demand Forecast, First Quarter 2024
Release Date: March 2024
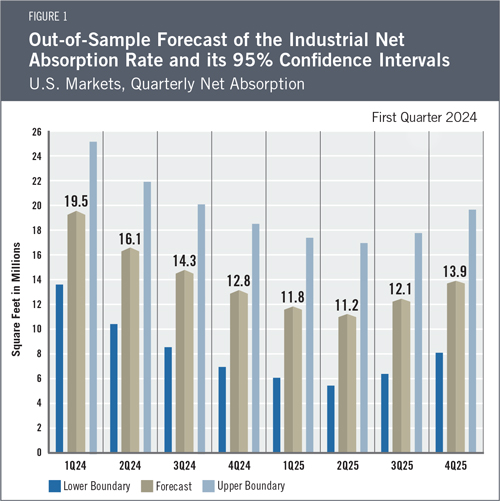
With the U.S. economy expected to continue to grow slowly, the authors estimate that quarterly net absorption of industrial space will average 14.0 million square feet per quarter over the next two years, or 62.8 and 49.1 million square feet in 2024 and 2025, respectively. This forecast represents a relative “cooling” trend following what had been a protracted period of above-average industrial absorption following COVID-era demand shifts that accelerated the need for distribution space to meet consumers’ increased preference for home delivery. As such, the projected slowdown in net absorption reflects more of a “return to normal” than a negative outlook for occupiers of industrial real estate.
The Industrial Market
After two years of absorption that significantly exceeded long-term averages, industrial net absorption in 2023 totaled just 93.7 million square feet compared with a record high of 486.6 million square feet of completions. While such a supply and demand imbalance is usually a cause for concern, the effect has been to bring balance back to an industrial market that had been substantially undersupplied since 2020.
The national availability rate ended 2023 at 7.1%, significantly above the post-pandemic low of 4.6% seen in the second quarter of 2022, but right in line with the lows experienced from 2015 through 2020. Nonetheless, short-term softness in effective rents is plausible, especially in markets with large amounts of new, vacant space. Supply and demand should return to balance as the rising cost of debt and equity make new construction, especially speculative development projects, difficult to execute. Furthermore, anecdotal evidence suggests some tenants will seek to take advantage of a softer rental market to expand their footprint more aggressively than in 2023. A convergence of supply and demand should contribute to a stable and gradually expanding national market for industrial space over the next two years, barring any unexpected economic shocks.
Economic Trends
Despite a year of heighted fear of a recession induced by the Federal Reserve, the U.S. economy grew 2.5% in 2023 and at a 3.3% annualized rate in the fourth quarter.1 With inflation appearing to slow to approximately 3% by various measures, compared to over 6% in 2022,2 there is growing optimism that interest rates can fall in 2024 and 2025. The markets and most economists now expect a “soft landing” for the economy in 2024.
This should help industrial demand increase toward the end of 2025 as rising business confidence combines with a growing economy. Still, economic conditions in 2024 are likely to remain rocky until inflation is within the Federal Reserve’s target range and interest rates have declined.
The labor market’s strength and resiliency have been particularly encouraging, with monthly net job gains averaging 225,000 for 2023 and unemployment finishing the year at just 3.7%.3 The U.S. economy is stable and growing, despite headwinds from an inverted yield curve and recently elevated inflation. This does not suggest that a recession is impossible in 2024 or later, but macroeconomic data do not currently suggest a trend toward negative growth. Instead, the forecast assumes a base case of positive but slower growth in both economic output and hiring in the coming quarters.
The Forecast Model
The authors utilize various explanatory drivers in the forecast’s statistical model, such as lagged net absorption, real gross domestic product growth, inflation and output gaps, monetary policy, and seasonal effects. CBRE Econometric Advisors calculates industrial net absorption based on change in space availability, including for space that is currently under construction and can be pre-leased. This has recently resulted in greater volatility in reported net absorption than if net absorption were based on changes in vacancy.
The current forecast has been revised downward to account for cooling demand for industrial space after the unprecedented increase in net absorption in the first two years of the COVID-19 pandemic and an expected slowdown in the rate of macroeconomic growth. The full-year forecast for industrial absorption in 2024 is 62.8 million square feet, with lower and upper boundaries of 39.6 and 86.0 million square feet, respectively. Absorption is projected to bottom out in the first half of 2025 and then rebound in the second half of the year, with predicted net absorption during the full year of 49.1 million square feet, with lower and upper boundaries of 25.9 and 72.3 million square feet, respectively.
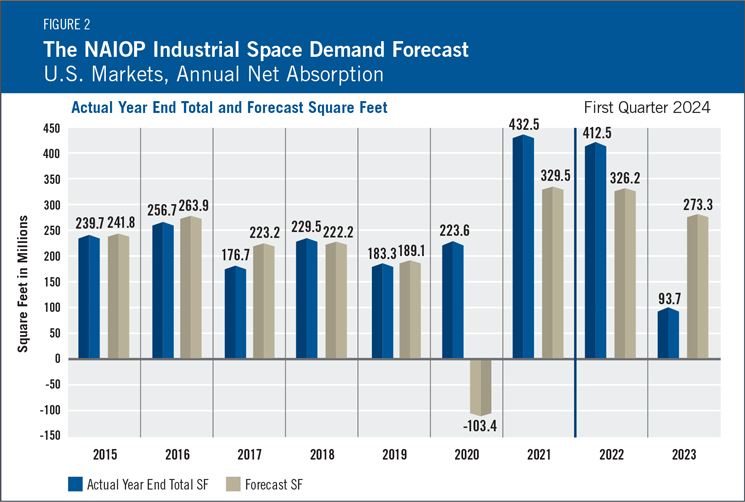
Actual Versus ForecastNet absorption in 2023 was down substantially from 2022, reflecting a generalized slowdown in business investment due to high interest rates and fears of a recession (see Figure 2). During 2023, 93.7 million square feet of industrial space was absorbed, compared with the forecast of 273.3 million square feet. Much of this difference is attributed to significant shifts in interest rates and a recovery previously expected for the latter half of 2023 that did not materialize. |
Key Inputs and Disclaimers
The predictive model is funded by the NAIOP Research Foundation and was developed by Guirguis and Randy Anderson, PhD, formerly of the University of Central Florida. The model, which forecasts demand for industrial space at the national level, utilizes variables that comprise the entire supply chain and lead the demand for space, resulting in a model that can capture most changes in demand.
While leading economic indicators have been able to forecast recessions and expansions, the indices used in this study are constructed to forecast industrial real estate demand expansions, peaks, declines and troughs. The Industrial Space Demand model was developed using the Kalman filter approach, where the regression parameters are allowed to vary with time and thus are more appropriate for an unstable industrial real estate market.
The forecast is based on a process that involves testing more than 40 economic and real estate variables that theoretically relate to demand for industrial space, including varying measures of employment, GDP, exports and imports, and air, rail and shipping data. Leading indicators that factor heavily into the model include the Federal Reserve Board’s Index of Manufacturing Output (IMO), the Purchasing Managers Index (PMI) from the Institute of Supply Management (ISM) and net absorption data from CBRE Econometric Advisors.
Authors
Hany Guirguis, Ph.D., Professor, Economics and Finance, Manhattan College
Joshua Harris, Ph.D., Executive Director, Fordham Real Estate Institute, Fordham University
Media Inquiries
Please contact Kathryn Hamilton, vice president for marketing and communications, at hamilton@naiop.org.
1 Bureau of Economic Analysis, “Gross Domestic Product, Fourth Quarter and Year 2023 (Advance Estimate),” news release, January 25, 2024, https://www.bea.gov/news/2024/gross-domestic-product-fourth-quarter-and-year-2023-advance-estimate.
2 U.S. Bureau of Labor Statistics, “Consumer Price Index Summary,” news release, January 11, 2024, https://www.bls.gov/news.release/cpi.nr0.htm.
3 U.S. Bureau of Labor Statistics, “Employment Situation Summary,” news release, January 5, 2024, https://www.bls.gov/news.release/empsit.nr0.htm.
