


Industrial Space Demand Forecast, Third Quarter 2023
Release Date: August 2023
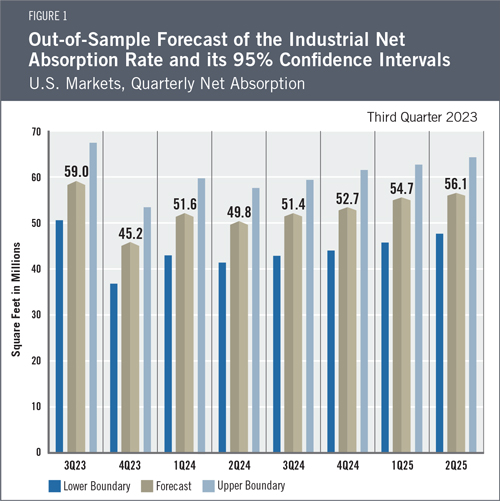
Given current economic conditions and recent demand trends, the authors estimate that quarterly net absorption of industrial space will average 52.6 million square feet over the next two years. Total net absorption for the second half of 2023 is forecast to be approximately 104 million square feet; full-year absorption in 2024 is forecast to be around 205 million square feet; and absorption in the first half of 2025 is forecast to be approximately 111 million square feet (see Figure 1 for quarterly projections).
The Industrial Market
The industrial market remains relatively healthy, although not as strong as it was last year. After several quarters of demand for industrial space outstripping supply, the reverse has been true since the third quarter of 2022. Construction starts and transactions have slowed, reflecting higher interest rates, tighter lending standards and cooling demand. Supply and demand for industrial space appear to be converging toward a slower pace of growth that is more aligned with pre-pandemic trends.
The national vacancy rate stands at a historically healthy 3.7%, though vacancies vary greatly between different geographic markets. Port markets on both the East and West Coasts have the lowest vacancy rates, with markets in the Midwest having slightly higher rates. Average net asking rents are up 9.9% year-over-year.1 Interestingly, vacancy rates have increased slightly alongside rent growth. This reflects the delivery of new high-quality industrial space that can command higher rents. New deliveries have outpaced absorption, contributing to the uptick in vacancies. Land constraints in port markets present a barrier to new construction, contributing to lower vacancy rates and higher rents in those markets.
Economic Trends
The U.S. economy grew at an annualized real rate of 2.4% in the second quarter2 but faces several challenges during the second half of the year. The Federal Reserve is expected to continue to support a high interest rate environment. High interest rates and declining personal savings levels among consumers will likely result in slower economic growth.
The unemployment rate (3.5%) and the labor force participation rate (62.6%) have not moved much during the past year and a half.3 Trade tensions with China and the Russia-Ukraine war are inhibiting international trade. Consumer confidence is up,4 but business confidence is down.5 The Composite Leading Economic Index is down 4.2% over the last six months, suggesting economic growth will continue to slow.6
The Forecast Model
The authors utilize various explanatory drivers in the forecast’s statistical model, such as lagged net absorption, real gross domestic product growth, inflation and output gaps, monetary policy, and seasonal effects. CBRE Econometric Advisors calculates industrial net absorption based on change in space availability, including for space that is currently under construction and can be pre-leased. This has recently resulted in greater volatility in reported net absorption than if net absorption were based on changes in vacancy. To account for this volatility, the forecast’s predictive model uses a moving average of historical net absorption rates.
The current forecast has been revised downward to account for cooling demand for industrial space after the unprecedented increase in net absorption in the first two years of the COVID-19 pandemic. The predicted net absorption during the second half of 2023 is 104 million square feet, with lower and upper boundaries of 88 and 121 million square feet, respectively. The full-year forecast for industrial absorption in 2024 is 205 million square feet, with lower and upper boundaries of 172 and 239 million square feet. Additionally, the predicted net absorption during the first half of 2025 is 111 million square feet, with lower and upper boundaries of 94 and 127 million square feet, respectively.
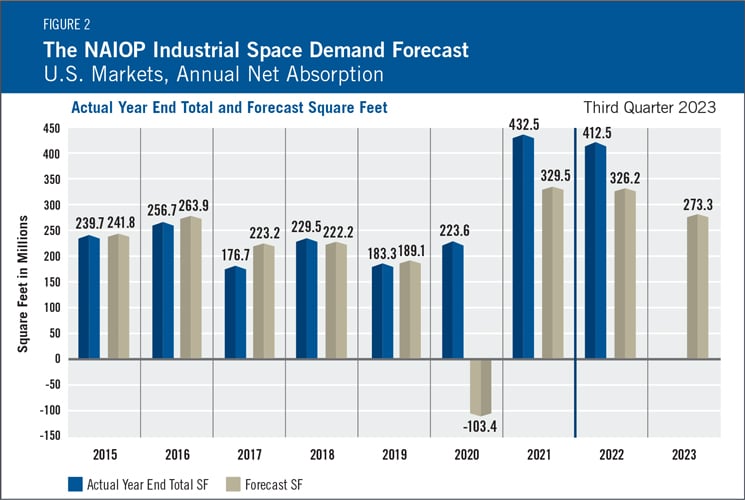
Actual Versus ForecastNet absorption in 2022 was down slightly from 2021, reflecting cooling economic growth and a shift in consumer spending from goods to services (see Figure 2). During 2022, 412.5 million square feet of industrial space was absorbed, compared with the forecast of 326.2 million square feet. Note that CBRE Econometric Advisors substantially revised its historical absorption data for the first two quarters of 2022, increasing reported absorption in the first half of the year. Since lagged absorption has a significant effect on the predictive model, the lower absorption data that was then available for the third-quarter forecast resulted in a lower forecast for the second half of 2022 than would have been the case if the authors had received the current version of the historical data. The first-quarter 2022 forecast had predicted absorption of 401.4 million square feet for 2022, or 2.7% less than the actual absorption for the year. |
Key Inputs and Disclaimers
The predictive model is funded by the NAIOP Research Foundation and was developed by Guirguis and Randy Anderson, PhD, formerly of the University of Central Florida. The model, which forecasts demand for industrial space at the national level, utilizes variables that comprise the entire supply chain and lead the demand for space, resulting in a model that can capture most changes in demand.
While leading economic indicators have been able to forecast recessions and expansions, the indices used in this study are constructed to forecast industrial real estate demand expansions, peaks, declines and troughs. The Industrial Space Demand model was developed using the Kalman filter approach, where the regression parameters are allowed to vary with time and thus are more appropriate for an unstable industrial real estate market.
The forecast is based on a process that involves testing more than 40 economic and real estate variables that theoretically relate to demand for industrial space, including varying measures of employment, GDP, exports and imports, and air, rail and shipping data. Leading indicators that factor heavily into the model include the Federal Reserve Board’s Index of Manufacturing Output (IMO), the Purchasing Managers Index (PMI) from the Institute of Supply Management (ISM) and net absorption data from CBRE Econometric Advisors.
Authors
Hany Guirguis, Ph.D., Professor, Economics and Finance, Manhattan College
Michael J. Seiler, DBA, J.E. Zollinger Professor of Real Estate & Finance, College of William & Mary
Media Inquiries
Please contact Kathryn Hamilton, vice president for marketing and communications, at hamilton@naiop.org.
1 CBRE, “Asking Rents Hit Record High Despite Rising Vacancy,” July 28, 2023, https://www.cbre.com/insights/figures/q2-2023-us-industrial-figures.
2 Bureau of Economic Analysis, “Gross Domestic Product, Second Quarter 2023 (Advance Estimate),” news release, July 27, 2023, https://www.bea.gov/news/2023/gross-domestic-product-second-quarter-2023-advance-estimate.
3 U.S. Bureau of Labor Statistics, “Employment Situation Summary,” news release, August 4, 2023, https://www.bls.gov/news.release/empsit.nr0.htm.
4 University of Michigan, “Surveys of Consumers: Final Results for July 2023,” http://www.sca.isr.umich.edu/.
5 OECD, “Business Confidence Index (BCI),” July 2023, https://data.oecd.org/leadind/business-confidence-index-bci.htm.
6 The Conference Board, “US Leading Indicators,” news release, July 20, 2022, https://www.conference-board.org/topics/us-leading-indicators.
