


Industrial Space Demand Forecast, First Quarter 2022
Release Date: February 2022
Scarcity Drives Unprecedented Industrial Space Demand
Just when the industrial market seemed it could not get any stronger, the new year has seen demand for space far outpace the supply of new product. Rents have correspondingly increased rapidly, and many firms simply cannot find space to lease. The scarcity is so great that firms are getting creative by renting properties that can be adapted to serve their purposes, locating facilities further away from their final destinations and building vertically.
Concerns over access to future space needs have even resulted in larger firms occupying extra space today to avoid problems in the future and signing leases on buildings long before they are built.1 This, of course, lowers current vacancy rates and worsens the problem in the short run. Smaller firms often do not have this ability. Because of this, they are finding it difficult to expand. In more densely populated areas, land is physically constrained and/or zoning prohibits the ability to add supply, leaving a true shortage with no obvious solution.
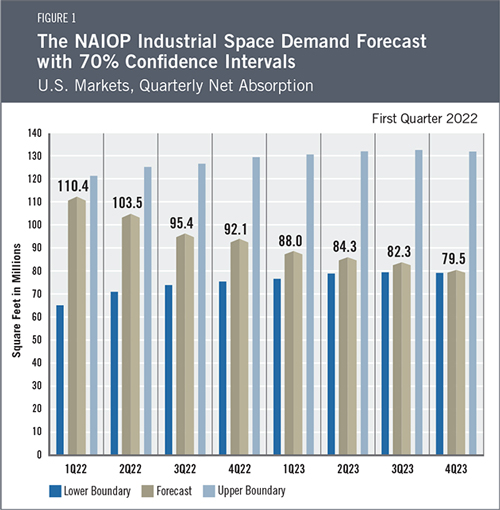 Given these trends, authors Dr. Hany Guirguis and Dr. Michael Seiler forecast that the total net absorption of industrial space in 2022 will be 401.4 million square feet with a quarterly average of 100.4 million square feet. In 2023, the projected net absorption is 334. 1 million square feet with a quarterly average of 83.5 million square feet. The solid upward revision of the 2022 forecast can be attributed to retailers and manufacturers expanding their inventories to avoid future supply shortages and the expected good performance of the economy in 2022 and 2023. The economy’s transition from recovery to expansion supports higher employment and a rising growth rate for real gross domestic product (GDP).
Economic Trends
In January, the Consumer Price Index (CPI) increased by 7.5% year-over-year, a 40-year high.2 Despite legitimate inflationary concerns, the economy continues to recover as real GDP increased by 6.9% in the fourth quarter of 2021.3 Looking ahead, consumer sentiment in February was 61.7, its lowest level in over a decade, reflecting growing concerns about inflation.4 Interest rates are projected to increase in response to the Federal Reserve’s attempt to stabilize prices.5
Wage growth has continued,6 although workers are more concerned about the growth in future real wages. That said, consumer demand for goods remains strong, which supports demand for industrial real estate. The unemployment rate is finally leveling off at around 4% after continuously declining since April 2020. Overall, while many share concerns over the future of the economy, the current state fosters continued growth in demand for industrial real estate.
The Forecast Model
In the statistical model, the authors utilize various explanatory drivers such as the lagged net absorption, growth in real gross domestic product, inflation and output gaps, monetary policy and seasonal effects. It should be noted that the forecasts have gone through significant revisions to account for new leasing behavior in the past four quarters, as well as the significant upward revisions of the historical net absorption in the fourth quarter of 2020 and first quarter of 2021 in data provided by CBRE Econometrics Advisors.
The empirical work is based on three scenarios. The first presents the upper boundary of the forecast, which assumes that end-users will continue to lease more space than they immediately need until the end of 2023. The second scenario presents the lower boundary where this behavior is a temporary phenomenon that will cease in 2022 and 2023. Finally, the base forecast assumes occupiers will gradually return to typical leasing behavior over the next two years, and absorption will be equal to the lower boundary forecast by the fourth quarter of 2023.
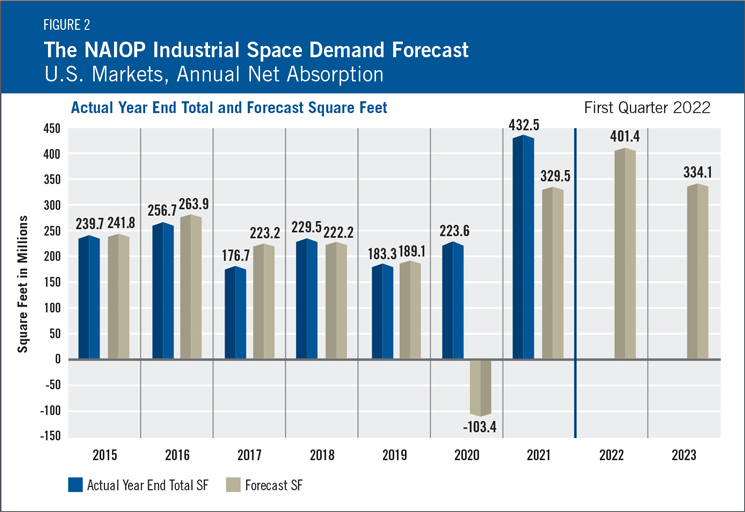
Actual Versus ForecastNet absorption in 2021 was almost double the absorption observed in 2020, reflecting rapid economic growth, continued growth in consumer spending on goods and the expansion of e-commerce (see Figure 2). During 2021, 432.5 million square feet of industrial space was absorbed, compared with the forecast of 329.5 million square feet. Note that CBRE Econometric Advisors substantially revised its historical absorption data for the first two quarters of 2021, increasing reported absorption in the first half of the year by 34 million square feet. Since lagged absorption has a significant effect on the forecast, the lower absorption data that was then available resulted in a lower forecast for the second half of 2021 than would have been the case if the authors had received the current version of the historical data. |
Key Inputs and Disclaimers
The predictive model is funded by the NAIOP Research Foundation and was developed by Guirguis and Randy Anderson, PhD, formerly of the University of Central Florida. The model, which forecasts demand for industrial space at the national level, utilizes variables that comprise the entire supply chain and lead the demand for space, resulting in a model that can capture most changes in demand.
While leading economic indicators have been able to forecast recessions and expansions, the indices used in this study are constructed to forecast industrial real estate demand expansions, peaks, declines and troughs. The Industrial Space Demand model was developed using the Kalman filter approach, where the regression parameters are allowed to vary with time and thus are more appropriate for an unstable industrial real estate market.
The forecast is based on a process that involves testing more than 40 economic and real estate variables that theoretically relate to demand for industrial space, including varying measures of employment, GDP, exports and imports, and air, rail and shipping data. Leading indicators that factor heavily into the model include the Federal Reserve Board’s Index of Manufacturing Output (IMO), the Purchasing Managers Index (PMI) from the Institute of Supply Management (ISM) and net absorption data from CBRE Econometric Advisors.
Authors
Hany Guirguis, Ph.D., Professor, Economics and Finance, Manhattan College
Michael J. Seiler, DBA, J.E. Zollinger Professor of Real Estate & Finance, College of William & Mary
Media Inquiries
Please contact Kathryn Hamilton, vice president for marketing and communications, at hamilton@naiop.org.
1 Miranda Spivack, “Warehouse Space Is the Latest Thing Being Hoarded,” The New York Times, February 1, 2022, https://www.nytimes.com/2022/02/01/business/warehouses-supply-chain.html.
2 U.S. Bureau of Labor Statistics, Consumer Price Index, https://www.bls.gov/cpi/.
3 U.S. Bureau of Economic Analysis, “Gross Domestic Product, Fourth Quarter and Year 2021 (Advance Estimate),” news release, January 27, 2022, https://www.bea.gov/news/2022/gross-domestic-product-fourth-quarter-and-year-2021-advance-estimate#:~:text=Real%20gross%20domestic%20product%20(GDP,real%20GDP%20increased%202.3%20percent.
4 Surveys of Consumers, Preliminary Results for February 2022, University of Michigan, http://www.sca.isr.umich.edu/.
5 U.S. Department of the Treasury, “Daily Treasury Par Yield Curve Rates,” https://home.treasury.gov/resource-center/data-chart-center/interest-rates/TextView?type=daily_treasury_yield_curve&field_tdr_date_value=2022.
6 Federal Reserve Bank of Atlanta, “Wage Growth Tracker,” https://www.atlantafed.org/chcs/wage-growth-tracker.
