


Industrial Space Demand Forecast, First Quarter 2019
Release Date: February 2019
Industrial Demand to Remain Level as Economy Steadies
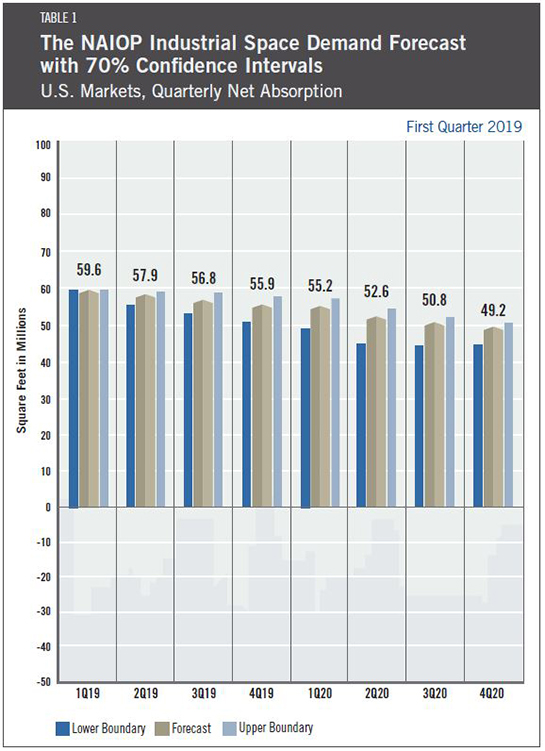
The forecast for net industrial space demand will remain steady in 2019. According to Dr. Hany Guirguis of Manhattan College and Dr. Joshua Harris of New York University, demand will remain at approximately 57 million square feet per quarter for 2019. That is unchanged from the average actual 2018 quarterly absorption of 57 million square feet. Industrial absorption in the final half of 2018 came in slightly above expectations due to higher consumer spending and retail sales, which were buoyed by a strong job market.
Industrial demand will be off to a strong start in 2019 with a potential tapering off into 2020 as rising interest rates moderate the economy’s growth rate. At present, the risk of a downturn in the industrial space market appears slim as the nationwide vacancy rate sits at a historically low 7.0 percent. Further, gross and net asking rents are at all-time highs, indicating that the market supply continues to tighten at a steady rate.
While data are somewhat suppressed due to the U.S. government shutdown that took place from December 22, 2018, until January 25, 2019, economic indicators point to moderate growth. The Federal Reserve Bank of Atlanta’s most recent GDPNow estimate of fourth quarter 2018 GDP growth is 2.7 percent, a decline from the robust 3.4 percent growth experienced in the third quarter.
Overall U.S. economic activity will remain steady in 2019, with annualized rates of GDP growth in the mid-2 percent range. Steady growth is the biggest factor keeping the industrial demand forecast stable. The labor market and overall consumer confidence are also expected to grow for the year, with industrial space demand increasingly influenced by consumer spending. However, there is concern about declining business sector investment, which the Federal Reserve Bank of Atlanta cites as a key explanation for the lower fourth-quarter GDP growth expectation.
The Conference Board’s Measure of CEO Confidence™ fell 13 points in the fourth quarter of 2018 to a level of 42, indicating more pessimism than optimism (any reading above 50 indicates growth). However, the Purchasing Managers’ Index (PMI), shown to be far more indicative of future industrial space demand, rose in January to 56.6 percent. That indicates improving and growing conditions.
Overall, the U.S. industrial real estate markets appear to be healthy and stable. It is the asset class that is potentially in the best position to weather any macroeconomic downturn that may come in the next several years. The areas of instability, which in recent months have driven stock market volatility and the decline in CEO Confidence, are due to international market concerns. In the U.S., manufacturing activity and employment appear to be poised to continue growing in 2019 and beyond due to structural factors such as new technology and willingness to re-shore foreign manufacturing operations. Similarly, online shopping activity set records this past holiday season, which only fuels the need for more warehouses and distribution centers in additional markets.
Key Inputs and Disclaimers
The predictive model is funded by the NAIOP Research Foundation and was developed by Guirguis and Dr. Randy Anderson, formerly of the University of Central Florida. The model, which forecasts demand for industrial space at the national level, utilizes variables that comprise the entire supply chain and lead the demand for space, resulting in a model that is able to capture the majority of changes in demand.
While leading economic indicators have been able to forecast recessions and expansions, the indices used in this study are constructed to forecast industrial real estate demand expansions, peaks, declines and troughs. The Industrial Space Demand model was developed using the Kalman filter approach, where the regression parameters are allowed to vary with time and thus are more appropriate for an unstable industrial real estate market.
The forecast is based on a process that involves testing more than 40 economic and real estate variables that theoretically relate to demand for industrial space, including varying measures of employment, GDP, exports and imports, and air, rail and shipping data. Leading indicators that factor heavily into the model include the Federal Reserve Board’s Index of Manufacturing Output (IMO), the Purchasing Managers Index (PMI) from the Institute of Supply Management (ISM) and net absorption data from CBRE Econometric Advisors.
ISM, the Federal Reserve and CBRE Econometric Advisors assume no responsibility for the Forecast. The absorption forecast tracks with CBRE data and may vary when compared with other data sets. Data includes warehouse, distribution, manufacturing, R&D and special purpose facilities with rentable building areas of 10,000 square feet or more.
Actual Versus Forecast
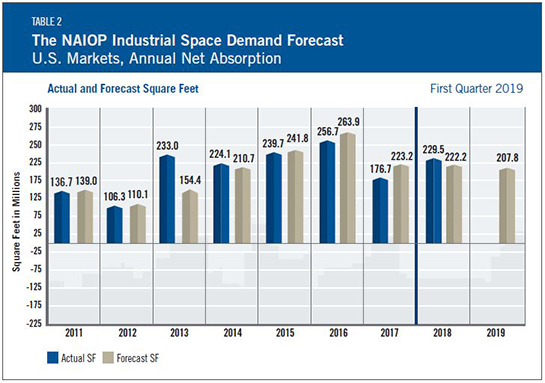
Although it got off to a slow start during the first half of 2018, the industrial market ended 2018 by performing closely with the previous forecast of net absorption. In 2018, 229.5 million square feet of industrial space was absorbed, inline with the forecast of 222.2 million square feet.
Initial and Ongoing Research
In 2009, the NAIOP Research Foundation awarded a research grant to Anderson and Guirguis to develop a model for forecasting net absorption of industrial space in the United States. That model led to successful forecasting two quarters out. A white paper describing the research and testing behind the model for NAIOP’s Industrial Space Demand Forecast is available.
The model was revised in 2012 to forecast eight quarters out. For this longer term forecast, Guirguis and Harris utilize the average central tendency forecast of the unemployment rate and growth rate of real GDP, provided by the seven members of the Board of Governors and the 12 presidents of the Federal Reserve Banks during the most recent Federal Open Market Committee meeting. Their forecasts are the independent variables in the equations. The forecasts usually vary from one year to another, so different techniques are applied to convert the yearly forecast to a quarterly one, in order to create the quarterly forecasts for net absorption. The estimated coefficients on the independent variables are estimated with the time-varying Kalman filter.
