
Seeing Past the Pandemic: Industrial Demand and U.S. Seaports
Release Date: March 2022
Supply chain disruptions have never been more salient to the average consumer. Congested seaports have received particular attention as record levels of inventory have piled up at ports and ships have been stuck offshore waiting to unload. While low levels of vacancy indicate robust current demand for industrial assets, developers, investors and building owners may wonder how closely industrial demand is tied to port activity and whether the current boom is sustainable.
This research brief, authored by Avison Young, reviews historical trends in port activity, local logistics employment, and vacancies, rents and absorption rates in adjacent industrial markets. Building on observations from the historical data, a regression analysis of the relationship between changes in port activity, truck traffic and industrial space absorption demonstrates that changes in import volume have a substantial effect on occupancy in port markets. Although the current port congestion may not last, industrial landlords can have confidence that port-accessible space will remain in high demand, even in the face of new construction.
Key Findings
|
Historical Overview
Port Activity
Port activity has increased consistently over the past 15 years with two major exceptions: the Great Recession and the early months of the COVID-19 pandemic. While the Great Recession slowed activity for years, by the second half of 2021, port activity had not only recovered to pre-pandemic levels but had risen above the previous trend.
Even with global supply chain dislocations lingering through 2021 and into 2022, many ports continue to process a record number of shipping containers. When analyzing major ports to include in this study, those with a minimum average monthly import volume of 18,000 20-foot equivalent units (TEUs)1 over the past 10 years were considered, accounting for the vast majority of containerized throughput for domestic seaports. While growth has been particularly robust in the Port of Savannah, the Los Angeles-Long Beach port complex remains by far the dominant U.S. port in terms of absolute volume (Figure 1).
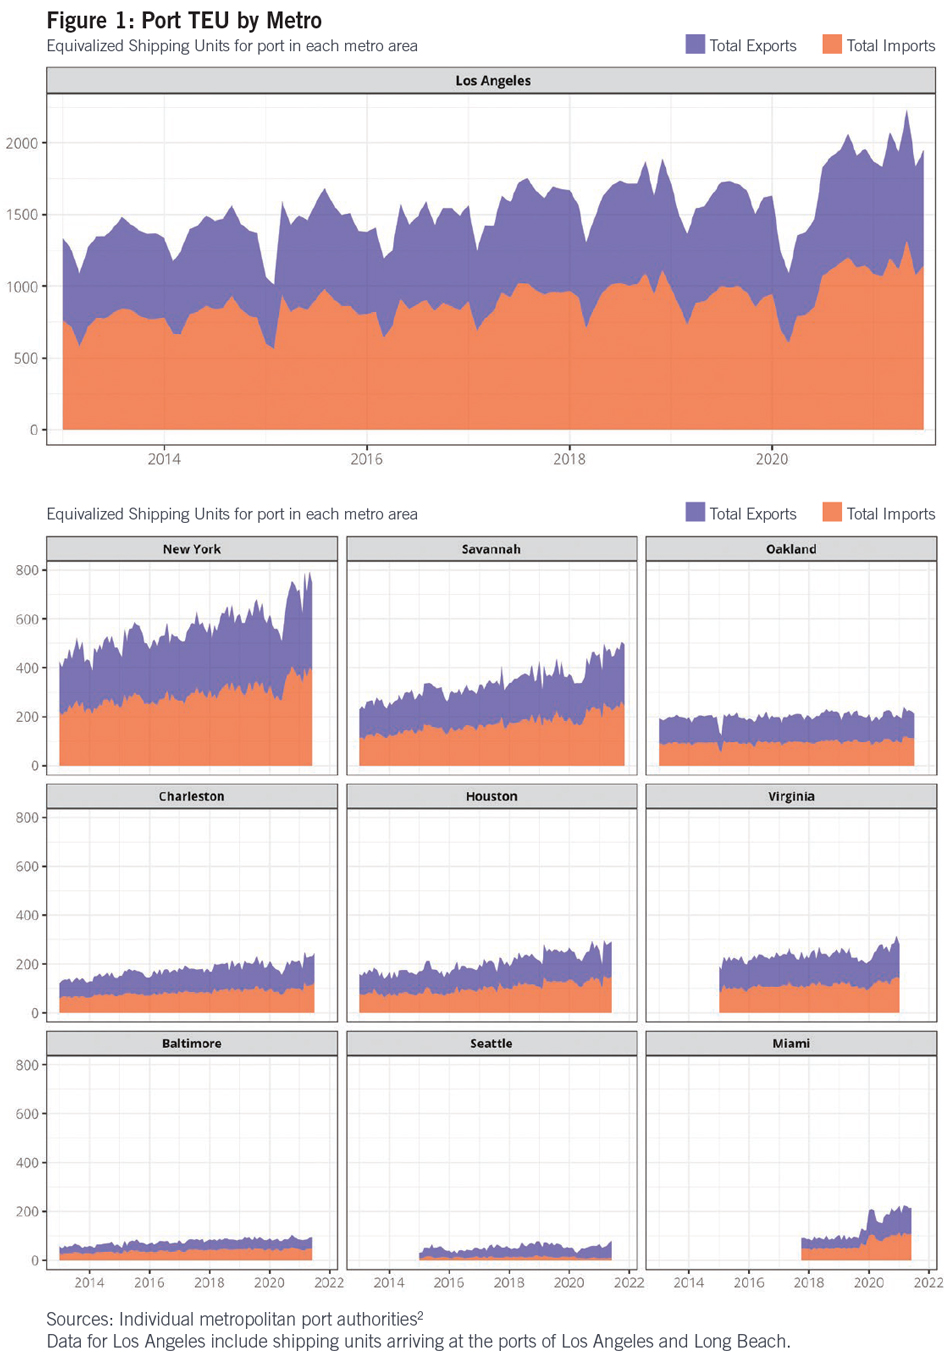
Although U.S. ports have exhibited growth in throughput during the past 20 years, the Great Recession, the opening of new locks in the Panama Canal (2016) and international trade disputes have had significant effects on shipping volumes. Recent improvements such as the Savannah Harbor Expansion Project (SHEP), the Miami Port Tunnel, Charleston’s Harbor Deepening Project and Baltimore’s Seagirt Marine Terminal berth-deepening boosted capacity and volumes. In Savannah and Houston, the opening of new locks on the Panama Canal in late June 2016 contributed to a subsequent increase in TEU volume. There was also a substantial dip in import activity at multiple ports following tariff increases in 2019.
Employment
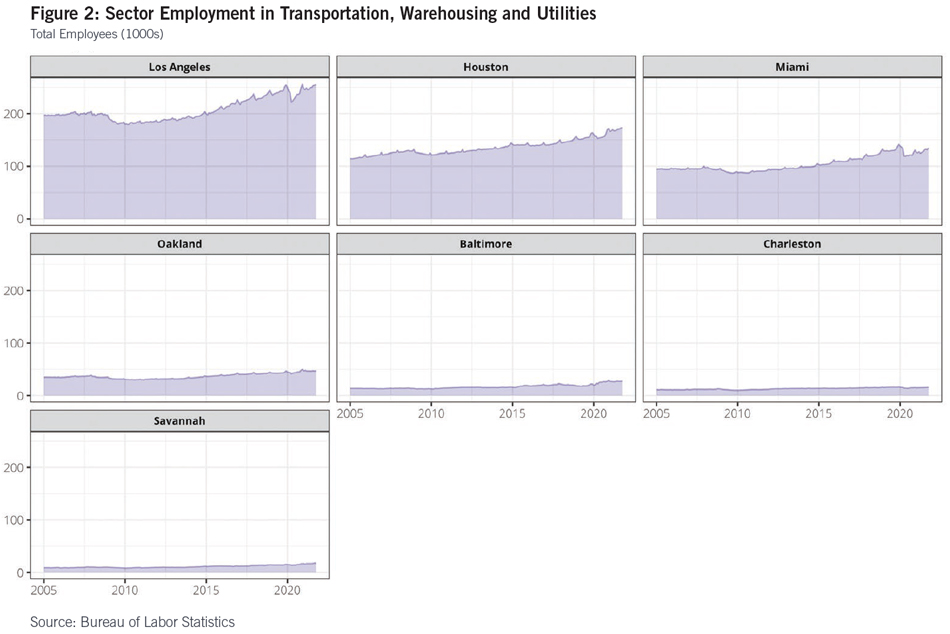
Employment in the transportation and warehousing sector shows similar patterns to port activity, particularly in smaller markets such as Savannah, where port-related activity forms a high percentage of total sector employment (Figure 2). After a period of stagnation, Baltimore metro-area employment in Transportation, Warehousing and Utilities increased sharply. Other markets have experienced comparatively steady growth. The 2019 tariffs did not seem to substantially affect sector employment. In some markets, shipping trends may be impacted by important events in other industries. For example, the collapse in crude oil prices in 2014 is evident in Houston’s sectoral employment trends.
The COVID-19 pandemic, however, led to sharp declines across the country. While the Transportation, Warehousing and Utilities sector has seen recovery since the start of the pandemic, employment levels in many markets remain below their pre-pandemic highs. The disconnect between the above-trend shipping activity and below-trend sector employment lies at the heart of the supply chain crisis, with many markets lacking enough warehouse and transportation workers to handle the recent increase in trade volume.
Real Estate Overview
Industrial Space Vacancies
In most major port markets, industrial vacancies are at or near historical lows (Figure 3).3
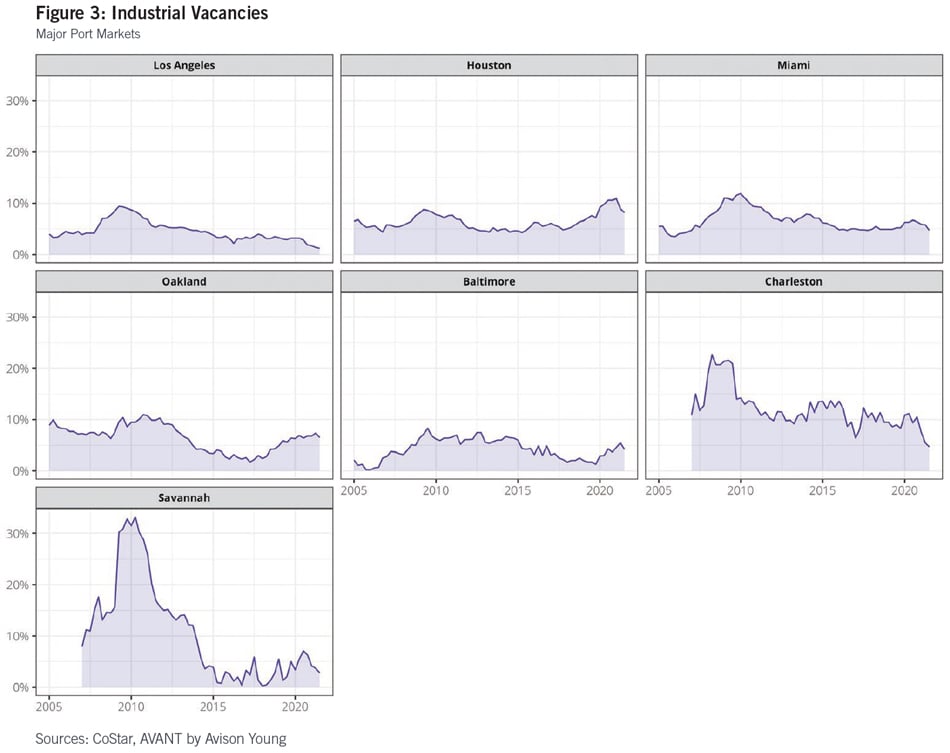
These low vacancies have occurred despite steady construction of new space, particularly in growing markets such as Savannah and Charleston, where new space has been absorbed quickly. Vacancy rates within the studied markets are 91 basis points lower than their aggregate 10-year average. Even in Houston and Baltimore, which have seen rising vacancies, recent data indicate a potential reversal. While the Los Angeles market may appear very stable, its large size means that even small changes can have significant implications for landlords and developers.
Industrial Absorption
Net absorption is the amount of space that tenants moved into minus the space that tenants vacated. A comparison of absorption to construction shows the degree to which new space has been truly incremental to market size. In markets with major ports, substantial new construction has been absorbed by the market over a sustained period without increasing vacancy (Figures 4a and 4b).
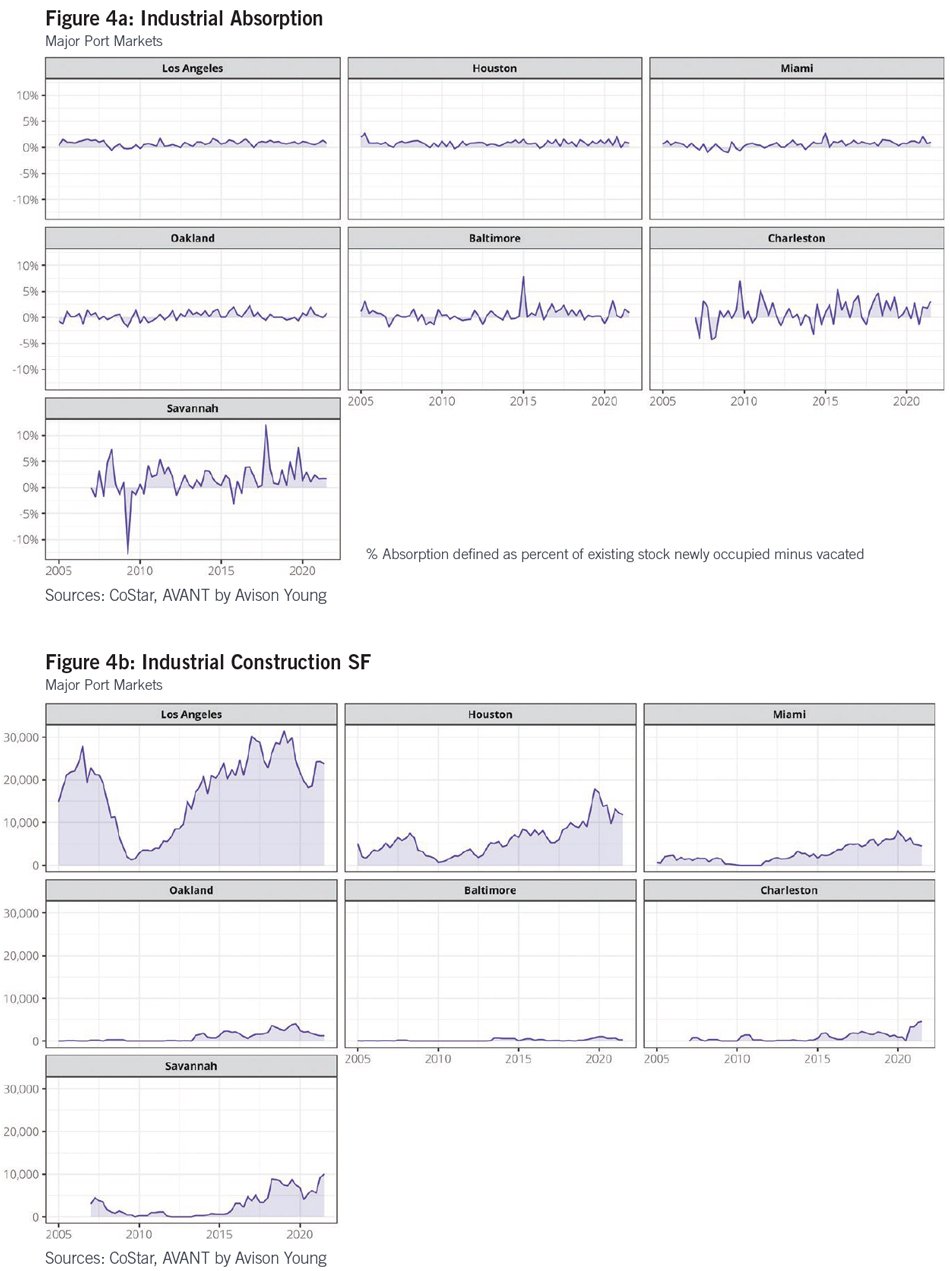
The pandemic halted some construction activity. Yet while annual development pipelines are sporadic within individual markets and their close-in port submarkets, most remain well above 2015 levels. Land availability and high land basis costs are limiting factors on the largest, most populous port markets. As such, the large industrial markets in Southern California are not expected to grow as fast as less mature or smaller-but-high growth markets in the Southeast. This holds true for Savannah and Charleston, as well as Virginia,4 which are growing at the fastest pace when measured by current levels of new construction as a percentage of existing inventory. At the same time, from 2015 to the present, the top major U.S. seaport markets have grown a weighted average of 25.0% in overall market inventory for warehouse, logistics and distribution space (among properties greater than 100,000 square feet), with Savannah nearly doubling in that timeframe.
Industrial Rents
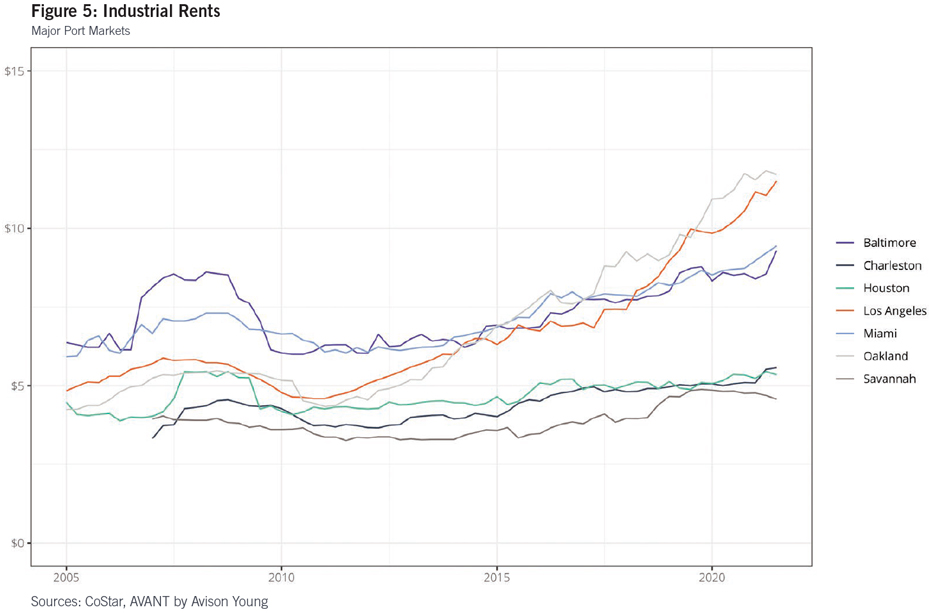
Competition and vacancies, driven down to extremely tight historical lows, have increased rents substantially in Southern California, while rents in up-and-coming ports like Savannah and Charleston have remained steady and range bound (Figure 5).
Port-Area Industrial Space Profiles
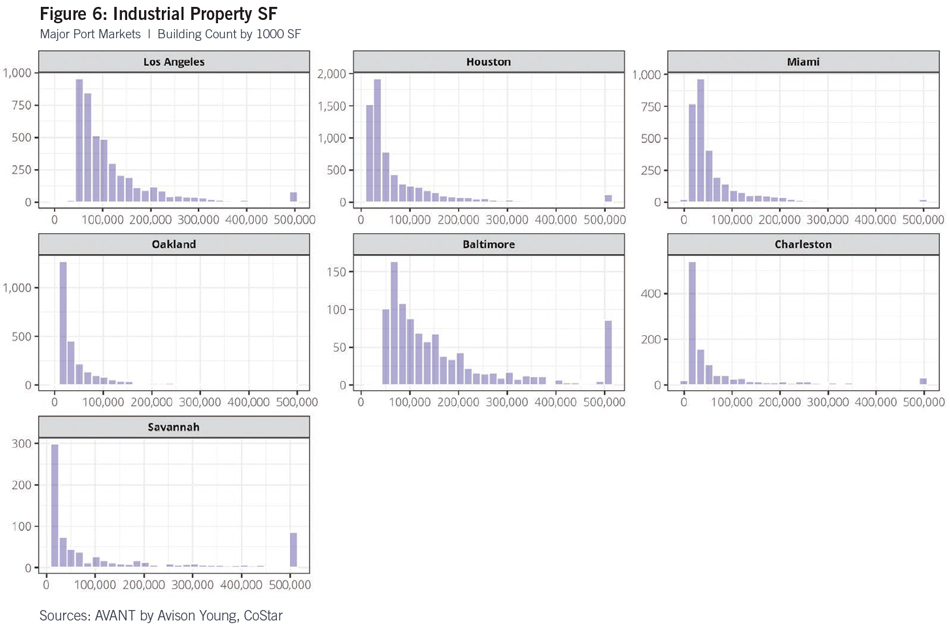
While very large warehouses may dominate some parts of the supply chain, most industrial properties in port markets are well under 100,000 square feet (Figure 6).
A Model of the Impact of Port Activity on Industrial Real Estate
Avison Young developed a model that describes how industrial space occupancy responds to changes in port activity and macroeconomic conditions. It uses a multilevel model structure to allow for differential impacts by port market, imports vs. exports and property distance to the port.
Before running the model, it is useful to determine where port deliveries are headed. If port goods are immediately shipped to far-off locations, the impact on local real estate may be modest. Using geospatial data from a partnership with Orbital Insight, Avison Young tracked truck trips from within the gates of each port terminal examined in this brief, isolating container loading and unloading areas. Only outbound trips were considered, allowing for an evaluation of the proportion of imports that are trucked to adjacent industrial real estate.
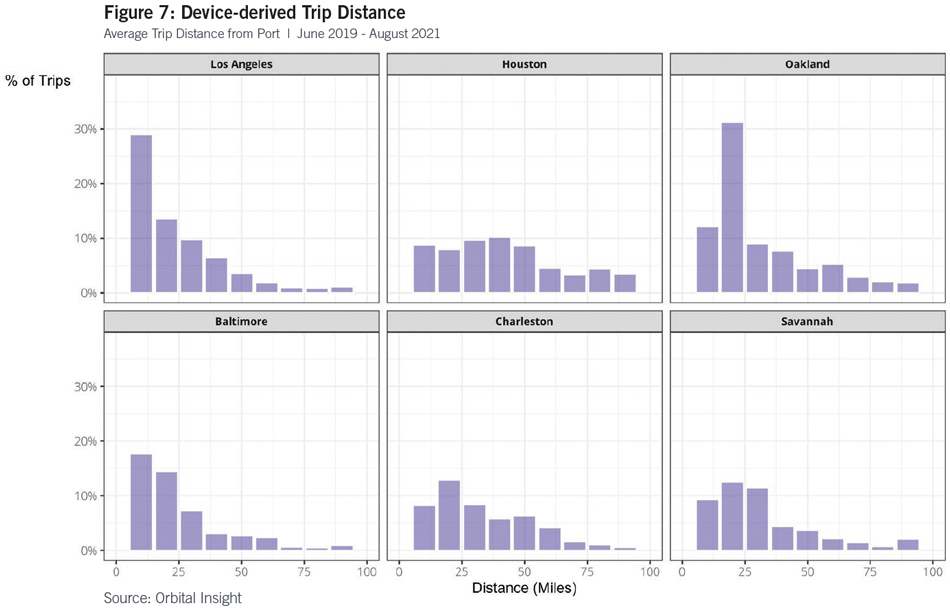
The data show the average distance of initial trips from ports. Most trips are relatively short. While incoming cargo from a port may eventually make it to many points around the country, its initial trip is likely to be within the 50-mile study radius (Figure 7). In many older ports, most trips are even shorter. This means that port activity has a major direct impact on its local real estate ecosystem, as cargo is likely to spend at least some time in nearby warehouses and distribution centers.
While the general pattern holds across ports, it is particularly true in older, more land-constrained ports in extremely dense areas like Baltimore and Los Angeles. In Houston, on the other hand, cargo spreads out into the larger metroplex.
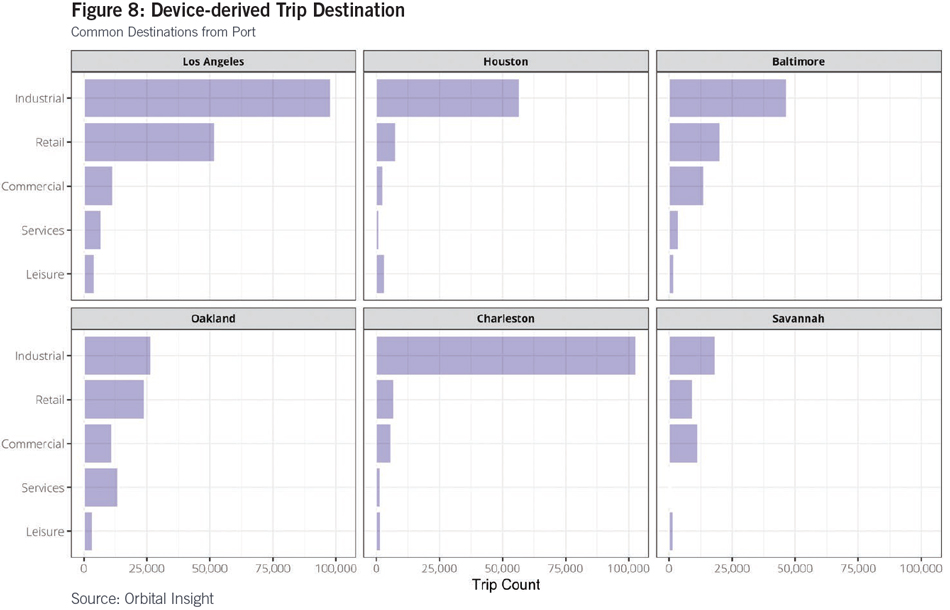
Not all cargo ends up in super-regional distribution centers, though. As noted in Figure 6, many of the warehouses that service ports are relatively small. And in some markets, like Los Angeles and Oakland, a significant portion of the trucks leaving ports go directly to a retail destination (Figure 8). Further, the most common destination for trips originating at most ports is the in-port, on-dock rail terminal, or a nearby intermodal container yard or transfer facility. The proportion of rail delivery varies substantially by port and functional capacity (Figure 9).
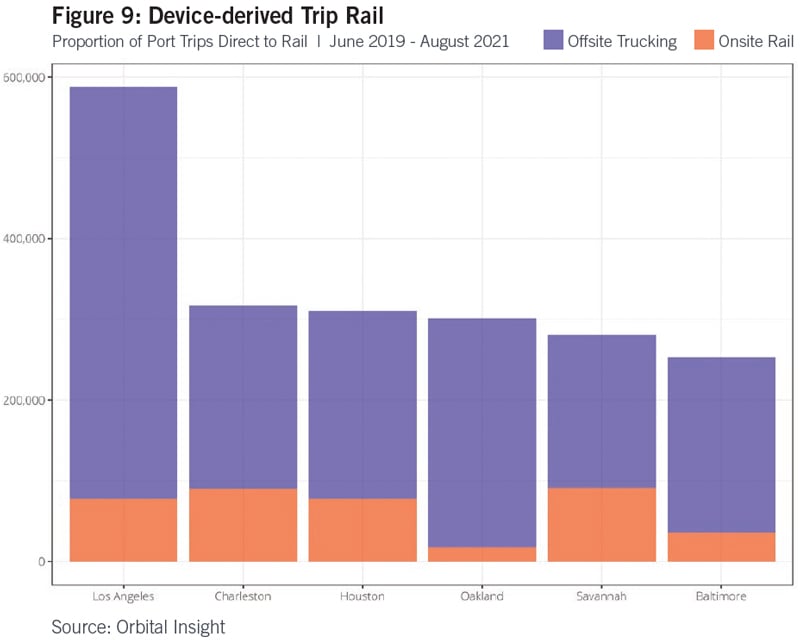
Accordingly, a significant proportion of trucking trips in the sample set end within adjoining markets or elsewhere in-state (Figure 10). Please note that transfers of containers within this dataset may not be sufficiently captured after immediate drayage after the first haul from the port.
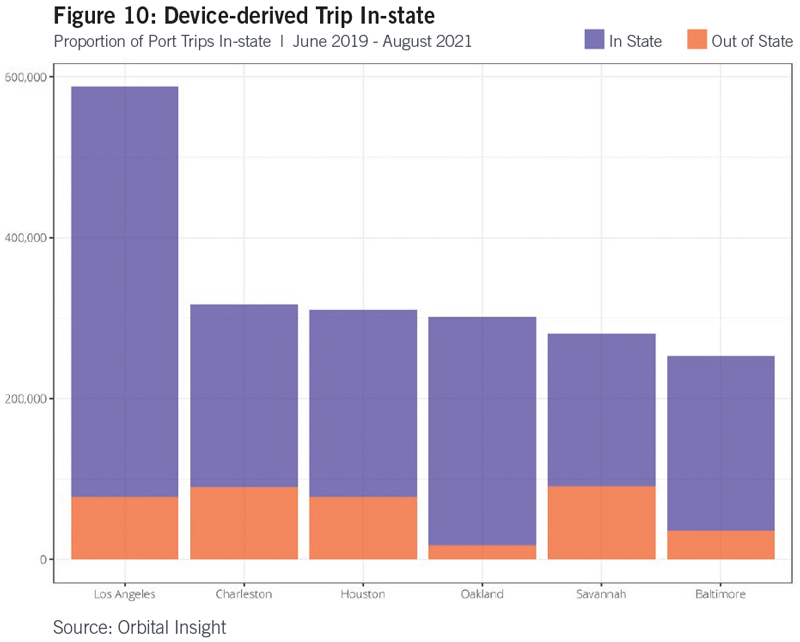
Understanding the percentage of cargo that ends up in the local distribution network can inform development decisions related to port activity. And since most cargo does stay local, at least initially, the model can assume that port shipments will affect local vacancies.
Seaports’ Impact on Real Estate Fundamentals
Increases in trade volume usually increase demand for warehouse space. In mature port markets, industrial vacancies have been low for several years. In Charleston and Savannah, port growth led to sharp declines in industrial vacancies. In contrast, vacancies rose in Oakland and Baltimore around the start of the pandemic, possibly due to both the economic downturn and the introduction of newly constructed space.
Vacancies only tell part of the story as they don’t account for new construction and the overall size of the market. The regression model instead attempts to explain changes in occupancy—absorption—as a function of changes in trade activity and macroeconomic factors, allowing for differential impacts by port market, property distance to port and imports vs. exports (Figure 11).
Imports and exports are represented by each port’s shipped TEUs. This volume-based metric is directly linked to demand for commercial space. Since occupancy could be driven by current shipping, reactions to previous activity, or anticipation of future volume, both lead and lag terms are included for TEUs. While same-month effects are strongest, both the lead and lag TEU terms are positive and significant for driving CRE occupancy. The model finds a stronger link between industrial space and imports than it does for exports.
To capture distance effects, the model considers industrial occupancy for two separate radiuses: properties within 10 miles of the port and properties within 50 miles of the port. General macroeconomic conditions are captured by each market’s GDP and unemployment rates. The model can then be used to simulate the changes in occupancy in response to changes in port TEU volume.
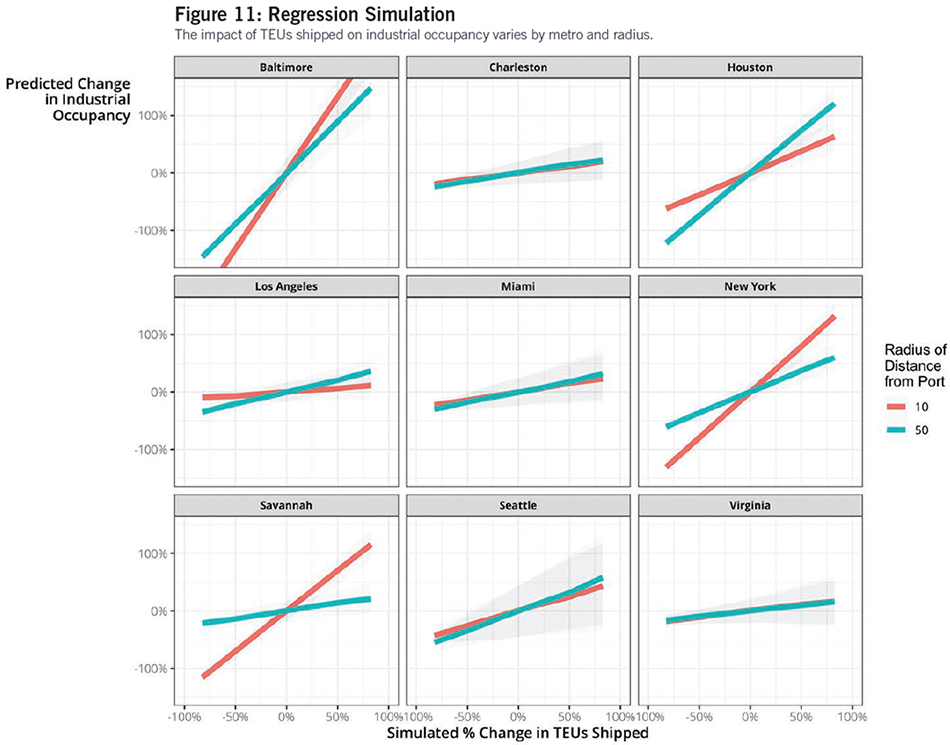
In all markets, an increase in TEUs shipped is associated with an increase in industrial occupancy, even controlling for general macroeconomic conditions. The degree to which an industrial market’s occupancy is affected by port volume varies, however.
In Los Angeles—a large, diversified market with a history of low vacancy—the slope is relatively gentle and is most noticeable in the larger 50-mile radius. In Houston, the overall relationship is steeper, but the sprawling layout of the metropolitan area means that trade impacts are seen most clearly across the larger port radius. This reinforces the pattern observed in the Orbital Insights trip data in Figure 7.
Savannah, on the other hand, is a smaller market whose economic fortunes are closely tied to the port. It has seen significant trade-driven growth over the last decade, and this is evident in the simulation. While Charleston has experienced similar rates of growth, Savannah likely benefits from both proximity to and interconnectivity with the major population hub of Atlanta, a relationship that has spurred the local real estate environment. Simulated increases in TEUs are associated with large increases in occupancy, particularly close to the port. In the New York metro area (which includes the Port of New Jersey), the old-growth concentration of industrial space in the immediate vicinity of the port is also evident. In other markets such as Seattle/Tacoma and Miami, switching between radiuses does not substantially alter the results. In these markets, the ports themselves are more geographically dispersed, with multiple port locations within the larger metro area.
The impact of port activity also depends on the proportion of a metropolitan area’s total industrial activity that is related to the port. The percentage of total industrial employment in the area represented by the Transportation, Warehousing and Utilities (TWU) sector serves as a proxy measure for this. For example, while Charleston and Savannah may seem like similar small, port-driven markets, Savannah’s TWU employment represents 39% of total industrial employment while Charleston’s represents only 24%. Similarly, while TWU employment represents 34% of New York’s industrial employment and 33% of Baltimore’s industrial employment, TWU only represents 20% of industrial employment in Seattle and 22% in the area near the Port of Virginia.
Has the Port Paradigm Truly Changed?
Seaport congestion has recently become the embodiment of supply chain troubles that contribute to inflation and consumer angst. While that may be immediately true, a longer-term perspective reveals that ports are engines for local and regionalized employment, throughput of goods leaving and entering the country, and demand for warehouse and distribution space, not just within adjacent markets, but throughout the country.
Decades of historical data show that growth in seaport activity has consistently supported the absorption of both new and existing industrial space. In up-and-coming port markets such as Savannah and Charleston, port development has supported a fundamental shift from high-vacancy to low-vacancy equilibria despite millions of square feet coming online during the past decade. In mature, populous port markets like Los Angeles, there is no sign of overbuilding, and market pressure has often led to large rent increases.
About NAIOP
NAIOP, the Commercial Real Estate Development Association, is the leading organization for developers, owners and related professionals in office, industrial, retail and mixed-use real estate. NAIOP comprises some 20,000 members in North America. NAIOP advances responsible commercial real estate development and advocates for effective public policy. For more information, visit naiop.org.
The NAIOP Research Foundation was established in 2000 as a 501(c)(3) organization to support the work of individuals and organizations engaged in real estate development, investment and operations. The Foundation’s core purpose is to provide information about how real properties, especially office, industrial and mixed-use properties, impact and benefit communities throughout North America. The initial funding for the Research Foundation was underwritten by NAIOP and its Founding Governors with an endowment established to support future research. For more information, visit naiop.org/researchfoundation.
About the Authors
Brian Harper
Brian is Avison Young’s Director of Data Science, covering all property sectors and relational inputs or drivers. His work involves incorporating and modeling complex datasets into actionable analytics for tenants, investors and landlords. Brian’s vast experience spans a wide range of industries, from IRI and Nielsen/Marketing Analytics to consulting with numerous Fortune 500 companies in sectors such as consumer package goods, quick-serve restaurants and automobiles. Brian applies a vision of data-rich environments that realize and rationalize hyper-transformative analytics for commercial real estate.
Aaron Ahlburn
Aaron is Avison Young’s global AVANT leader for the logistics and industrial sectors. With more than 20 years of experience in the industry, he focuses on data management, analytics, product visualizations and scalable point-of-sale deliverables and their incorporation into AVANT for Avison Young professionals and clients. His work integrates real estate market and economic trend data, sociodemographic data, supply chain fundamentals, and trade and transportation information into industry-specific products that provide direct intelligence and narrative, go-to-market strategies.
Media Inquiries
Please contact Kathryn Hamilton, vice president for marketing and communications, at hamilton@naiop.org.
Disclaimer
This project is intended to provide information and insights to industry practitioners and does not constitute advice or recommendations. NAIOP disclaims any liability for actions taken as a result of this project and its findings. © 2022 NAIOP Research Foundation
Endnotes
1 A twenty-foot equivalent unit or TEU is a unit of cargo capacity based on a 20-foot-long intermodal container.
2 TEU data come directly from the respective port authorities and have varying lengths of historical series available. All available data are represented in Figure 1.
3 Data covers the period from 2005 to present, except in select markets where data collection began later.
4 A port complex centered in Hampton Roads, Virginia.
* Research reports are complimentary to all audiences. Webinars are free for members and paid for nonmembers.

