Evaluating Cap Rate Investment Strategies

Which cap rate investment strategy generates the best return?
IS A HIGH OR a low cap rate property purchase a better investment? As is the case with all such questions, the response is that it depends. It depends on the property’s income growth potential, whether the property is being purchased as a value-add opportunity, the level of capital expenditures needed to maintain the income stream, the local market’s economic growth potential and other factors.
“Value Investment Strategies for Commercial Real Estate,” a paper by Eli Beracha, assistant professor, Florida International University; David Downs, professor and Alfred L. Blake Chair in Real Estate, Virginia Commonwealth University; and Greg MacKinnon, director of research, Pension Real Estate Association, focuses on holding period returns based on property purchase (“going in”) cap rates. The authors presented the paper at the Real Estate Research Institute’s annual research conference on May 11, 2017.
The analysis uses property-level data that forms the National Council of Real Estate Investment Fiduciaries (NCREIF) National Property Index (NPI). The NPI produces the most widely followed index of commercial real estate performance in the U.S. The NPI data used in the analysis is comprised of 23,981 different properties and 481,052 property-quarter observations that maintain an aggregate property value of $525 billion today. These properties were acquired between 1978 and 2011 and had holding periods that ended between 1983 and 2016.
This research is one of the first analyses using individual property-level NCREIF transaction data, as opposed to aggregated data at the metropolitan or national levels. The researchers were able to examine and compare cap rates for individual properties within and between markets.
NCREIF maintains very limited access to property-level data to keep investment confidentiality and provides property-level data for research purposes only. NCREIF member participants report property income, appreciation and capital expenditures on a quarterly basis. Properties in the NCREIF database used in this study include the four major commercial property types: office, industrial, retail and apartment. (The NCREIF database also includes hotels.) Each property data point also has location identifiers at the MSA and MSA subdivision levels. Overall, NCREIF provides excellent property-level data across all property types over a 35-year investment horizon.
No data set is without some limitations. All NCREIF members are institutional real estate investors; therefore the property investments in the database are of higher average quality — “institutional quality” — and may not be representative of the entire market. Property values are appraisal-based values, not market or sales-transaction values. Extensive research has been completed on appraisal bias in the NCREIF index. While there is a valuation lag effect (appraisal values lag transaction values by a quarter or two) and appraised values may smooth value volatility, there is no evidence that appraisal-based values maintain systematically high or low valuation bias.
Beracha, Downs and MacKinnon’s executive summary reveals these findings:
Our results show that high cap rate (value) properties earn higher returns compared with low cap rate properties, and outperform low cap rate properties on a risk-adjusted basis. The return differential is statistically significant, economically meaningful, and holds across property types and over the real estate cycle. Moreover, the value effect is evident both within and across locations so that, on average, higher cap rate properties within a category of CBSA [core based statistical area] outperform lower cap rate properties from the same CBSAs and higher cap rate CBSAs outperform lower cap rate CBSAs.
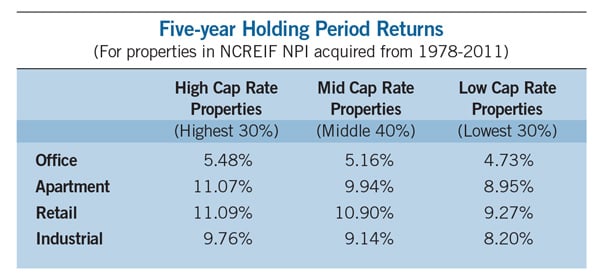
In their research, high/mid/low cap rate properties are identified as follows: high cap rates are the highest 30 percent of cap rates, mid-cap rates are the middle 40 percent and low cap rates are the lowest 30 percent. The table titled “Five-year Holding Period Returns” presents these returns for properties acquired between 1978 and 2011. Over the analysis period, office properties underperformed the other property types by about 500 basis points but, more importantly and relevant to the question being addressed, high cap rate property holding period returns uniformly outperformed mid cap rate and low cap rate holding period returns, and usually by a full percent or more. Importantly, these results also hold on a risk-adjusted basis when controlling for holding period standard deviation.
Do these results hold when one takes into account the possibility of value-add properties (i.e., properties with significant capital expenditure needs at the time of purchase)? Here the authors identify capital expenditure levels for high/mid/low cap rate purchases and find that high cap rate office, industrial and retail properties have lower average capital expenditures than low cap rate properties, suggesting that value-add purchases do not explain higher returns for higher cap rate properties.
For apartments, however, higher cap rate properties incurred average capital expenditures of 6.88 percent of property value over the five-year holding period as compared to 4.19 percent for low cap rate properties. While a 2.69 percent higher investment in capital expenditures over a five-year holding period is statistically significant, it is of relatively small magnitude, and too small to suggest that high cap rate apartment properties on average are value-add properties. So overall, the higher cap rate properties are not any more likely to be value-add acquisitions than low cap rate properties. This eliminates the possibility that investments in value-add properties explain the holding period return differences.
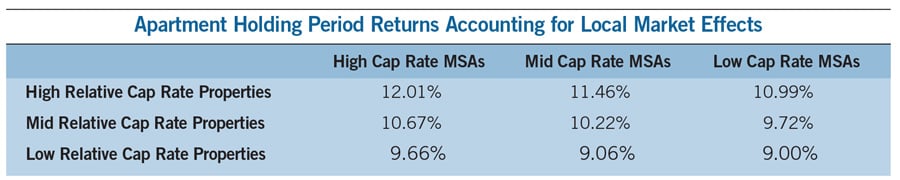
Finally, the authors look at high/mid/low cap rate properties in high/mid/low cap rate MSAs. In other words, they address the question: Do high cap rate properties in high cap rate markets outperform low cap rate properties in low cap rate markets? The table titled “Apartment Holding Period Returns Accounting for Local Market Effects” reveals the results for apartment properties; office and retail properties have a similar return pattern. Where high cap rate properties have higher holding period returns than low cap rate properties within high/mid/low cap rate MSAs (look down the columns in this table), high cap rate MSAs also outperform low cap rate MSAs across high/mid/low cap rate properties (look across the rows). For industrial properties, the results are mixed at the MSA level.
In summary, investing in high cap rate properties provides better holding period returns than investing in low cap rate properties, and high cap rate properties provide better returns after adjusting for risk, capital expenditures and local market effects.
However, it is worth noting that NPI five-year holding period returns averaged 8.7 percent at the national level for the period 1978 to 2011 across all properties and markets combined. Fully 7.4 percent of that return was from property income and 1.3 percent was from property appreciation. As U.S. inflation and, similarly, property growth rates have been very modest over the past 25 years — the personal consumption expenditure price index rose just 1.96 percent during that time period — it should not be surprising that property income and, in particular, income from high cap rate properties dominated property appreciation rates, which likely drove the findings in Beracha, Downs and MacKinnon’s research. In a future market with unknown inflation and price appreciation rates, especially in desirable gateway cities, outcomes could be different, which should give those investing in low cap rate properties in low cap rate MSAs some comfort.
Mark J. Eppli, Bell chair in real estate, Marquette University, and a NAIOP Distinguished Fellow
For more information: “Value Investment Strategies for Commercial Real Estate.”

RELATED ARTICLES YOU MAY LIKE