
The NAIOP Market Monitor shows sales in the largest office and industrial markets are picking up steam.
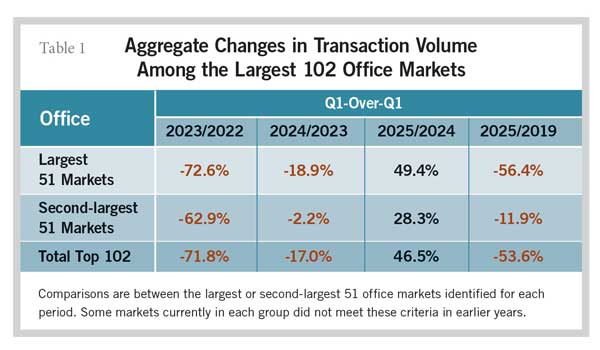
The 2025 NAIOP Market Monitor reveals that transaction volume in the largest 102 office and industrial markets in the U.S. has grown rapidly over the past year, following two years of contraction. Growth in transaction volume from the first quarter of 2024 to the first quarter of 2025 was concentrated in the largest 51 markets for each property type. That is a reversal from the post-2019 trend, in which smaller markets (the 52nd to 102nd largest) collectively saw smaller relative declines in office transactions and stronger relative growth in industrial sales (see Tables 1 and 2).
This is the third edition of the NAIOP Market Monitor, which followed NAIOP Research Foundation reports in 2020 and 2021 that examined traditional approaches to ranking and categorizing office and industrial markets. The NAIOP Market Monitor is an alternative that uses a two-dimensional grid to provide insight into relative market size (transaction volume) and volatility (in cap rates and transactions), allowing investors and developers to more easily identify markets that match their investment criteria and risk tolerance. The report is accompanied by a dashboard with interactive maps that allow users to see how the size and volatility of individual office and industrial markets have shifted over the previous year.
Relative transaction volume growth was strongest among the largest 51 office markets over the last year. Investors appear more willing to transact now that office absorption has stabilized, although fire sales of distressed and foreclosed properties may also be playing a role in the rebound. Sales volume in the first quarter among the largest 51 office markets remains more than 50% lower than it was in the same quarter in 2019. Office markets in Southeastern states attracted a growing share of office transaction volume.
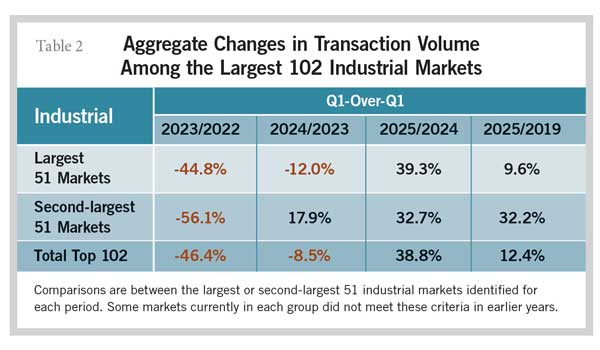
Industrial markets also experienced strong volume growth over the last year, and sales were higher than in the first quarter of 2019. However, the report observed that this has been accompanied by significant changes in the relative size and volatility of individual industrial markets, as investors and developers reallocate dollars to growing markets. Increases in volatility were concentrated in the Midwest, with volatility tending to decline in the Southeast and the Pacific and Mountain West. Regional shifts in transaction volume were more muted, although several Western markets experienced slower growth compared with the prior year.
The collective outperformance in sales volume growth among the second-largest group of office and industrial markets since 2019 may seem to contradict the long-standing narrative that the largest markets are typically safer options for investors, especially when considering that the shift toward hybrid and remote work particularly impacted sales performance among the largest office markets. However, the report observes that on an individual basis, a smaller market is much more likely to experience a significant relative change in volume due to a single large transaction or portfolio sale. The NAIOP Market Monitor and its accompanying dashboard allow users to more easily identify what individual markets — large and small — experience higher volatility in volume and cap rates, which markets are growing fastest, and those that tend to perform most consistently from year to year.
Access the NAIOP Market Monitor report and dashboard at naiop.org/naiopmarketmonitor.
Shawn Moura, Ph.D., is vice president for the NAIOP Research Foundation.