

Industrial Space Demand Forecast, Third Quarter 2016
Release Date: August 2016
Download the NAIOP Industrial Space Demand Forecast, Third Quarter 2016 Report.
Industrial Markets Exhibit Stability, Despite Turbulence
The U.S. economy in the first half of 2016 can be characterized as slowing but still growing, as GDP registered a revised 0.8 percent annualized growth rate in the first quarter and 1.2 percent in the second quarter (first estimate). Job growth also appears to be teetering, with a solid report released by the U.S. Bureau of Labor Statistics for July 2016 indicating an increase of 255,000 jobs (first release), exceeding expectations. This report was preceded by a strong reading for June of 287,000 jobs but a very weak report for May of just 38,000 jobs. This wavering could be signaling a slowdown, but it is too soon to tell. The consensus therefore remains that growth will continue to be positive and that the U.S. is not likely to enter into a recession in the near term.
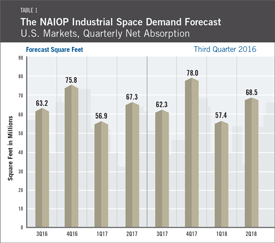
The industrial market — performing just 3.29 percent above the prior forecast — maintained stability by growing an average of 62.4 million square feet each quarter in the first half of 2016. According to Dr. Hany Guirguis, Manhattan College, and Dr. Joshua Harris, University of Central Florida, quarterly net absorption for the next two years is forecast to average between 65.8 and 66.6 million square feet.
It is important to note that these forecasts, as well as the year-to-date performance of the industrial market, do not yet fully account for expected future impacts from the recent Brexit vote and the rise in the U.S. dollar, as both are too recent to measure. The impact of the United Kingdom’s vote to leave the European Union, which at first seemed potentially severe, at this point appears to be relatively minimal. Guirguis and Harris note that “the biggest source of potential impact to the domestic industrial real estate market will likely come from the strong U.S. dollar and its effects on U.S. exports. Markets with a large number of manufacturing firms with significant export activity are the most vulnerable, along with shipping and transport-based markets.”
At present, most of the Institute for Supply Management (ISM) manufacturing indices used in this model, which help indicate future industrial demand, are still showing growth at an increasing rate. However, inventory indices, as of the June 2016 release, indicate contraction, meaning that business inventories are declining. This could lead to a reduction in industrial space demand. How these indices change over the next few months will provide meaningful information about demand for industrial space in 2017 and beyond.
Guirguis and Harris add that “increases in personal consumption expenditures (PCEs) have been the main source of growth keeping GDP positive, according to the U.S. Bureau of Economic Analysis. In addition, private consumption has perpetuated the sustained trend of increased e-commerce spending, which has been a boon to industrial space demand. As such, the steady rate of industrial net absorption forecast for the rest of 2016 and beyond may not be felt evenly in all markets in the U.S.”
Overall, the biggest source of risk to the economy and directly to the industrial space market is a reversal in hiring trends and thus a weakening in consumer confidence and spending. Consumers have remained diligent spenders, borrowers and homebuyers throughout the first half of 2016. There is no immediate reason to believe this will change. In fact, the preponderance of the evidence suggests that consumer spending may only strengthen. Factors such as relatively low and stable fuel prices, low interest rates and a stable job market form the basis for the consumer confidence that the U.S. has seen for many years. Wealth effects from record stock market levels and vastly recovered home prices appear to be a reinforcing feedback mechanism. These factors are, of course, sensitive to global markets, and there, once more, is where the risk lies.
Key Inputs and Disclaimers
The predictive model is funded by the NAIOP Research Foundation and was developed by Guirguis and Dr. Randy Anderson, formerly of the University of Central Florida. The model, which forecasts demand for industrial space at the national level, utilizes variables that comprise the entire supply chain and lead the demand for space, resulting in a model that is able to capture the majority of changes in demand.
While leading economic indicators have been able to forecast recessions and expansions, the indices used in this study are constructed to forecast industrial real estate demand expansions, peaks, declines and troughs. The Industrial Space Demand model was developed using the Kalman filter approach, where the regression parameters are allowed to vary with time and thus are more appropriate for an unstable industrial real estate market.
The forecast is based on a process that involves testing more than 40 economic and real estate variables that theoretically relate to demand for industrial space, including varying measures of employment, GDP, exports and imports, and air, rail and shipping data. Leading indicators that factor heavily into the model include the Federal Reserve Board’s Index of Manufacturing Output (IMO), the Purchasing Managers Index (PMI) from the Institute for Supply Management (ISM) and net absorption data from CBRE Econometric Advisors.
ISM, the Federal Reserve and CBRE Econometric Advisors assume no responsibility for the Forecast. The absorption forecast tracks with CBRE data and may vary when compared with other data sets. Data includes warehouse, distribution, manufacturing, R&D and special purpose facilities with rentable building areas of 10,000 square feet or more.
Actual versus Forecast
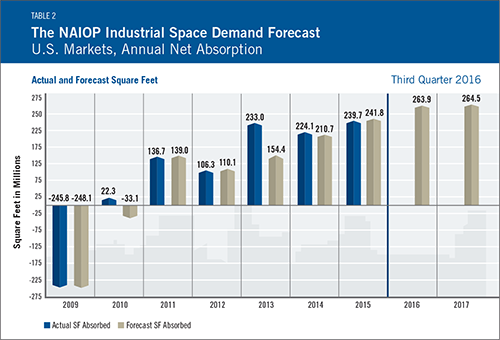
The Annual Net Absorption Table shows actual versus forecast net absorption. The model successfully projected a drop and rebound in net absorption in 2009 and 2010, as inventory supplies dwindled.
Initial and Ongoing Research
In 2009, the NAIOP Research Foundation awarded a research grant to Anderson and Guirguis to develop a model for forecasting net absorption of industrial space in the United States. That model led to successful forecasting two quarters out. A white paper describing the research and testing behind the model for NAIOP’s Industrial Space Demand Forecast is available on the NAIOP Research Foundation website.
The model was revised in 2012 to forecast eight quarters out. For this longer term forecast, Guirguis and Harris utilize the average central tendency forecast of the unemployment rate and growth rate of real GDP, provided by the seven members of the Board of Governors and the 12 presidents of the Federal Reserve Banks during the most recent Federal Open Market Committee meeting. Their forecasts are the independent variables in the equations. The forecasts usually vary from one year to another, so different techniques are applied to convert the yearly forecast to a quarterly one, in order to create the quarterly forecasts for net absorption. The estimated coefficients on the independent variables are estimated with the time-varying Kalman filter.
