Industrial Space Demand Forecast, First Quarter 2020
Release Date: February 2020
U.S. Industrial Space Demand Forecast Revised Upward
In mid-2019, industrial property experts expected slower performance as demand cooled while supply caught up. At the same time, businesses were cautious due to concerns over U.S.-China trade issues, a possible economic slowdown, and uncertainties over Britain’s possible exit from the European Union.
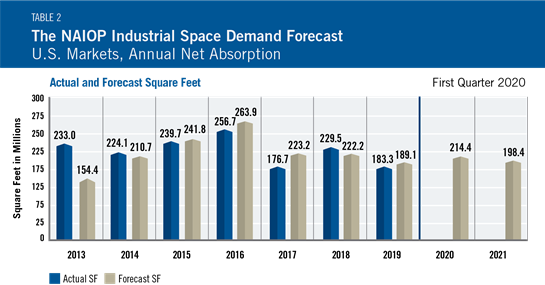
However, as trade disputes dissipate and the economy remains strong, NAIOP has revised its first quarter 2020 industrial forecast upward to early-2019 levels. According to Dr. Hany Guirguis of Manhattan College and Dr. Timothy Savage of New York University, quarterly net absorption will remain at or above 50 million square feet on a sustained basis through Q2 2021. Demand is forecast to decrease slightly over the next year, with net absorption estimated at 48 million square feet during the final quarter of 2021 (see Table 1).
U.S. fiscal and monetary policies continue to accommodate economic growth, and indicators suggest that the economy will remain healthy through 2020. Long-term U.S. interest rates continue to decline, and long- and short-term interest rates have largely decoupled. The yield curve remains relatively flat; the spread between 10-year and 3-month U.S. Treasury yields has been below 50 basis points (bps) for a year, and it was negative for nearly a quarter in 2019. Nominal long-term interest rates in many European countries are zero or slightly negative. Inflation in the U.S., measured by the 10-year break-even rate, remains nearly 50 bps below the Federal Reserve’s target of 2 percent.
Monthly job growth is robust, and the U3 measure of unemployment remains at cycle lows. Prime-age labor force participation continues to rise, perhaps induced by stronger wage growth.
E-commerce continues to surge. According to the Federal Reserve, e-commerce as a share of total final sales in the U.S. has grown approximately 1 percent per year, from 4 percent in 2010 to 11 percent in 2019.
MasterCard estimates that overall U.S. holiday sales increased 3.4 percent in 2019 relative to 2018. In contrast, e-commerce sales rose by nearly 19 percent. Growth in e-commerce directly and positively impacts the demand for industrial space, in particular last-mile industrial space close to dense urban centers such as New York City and Boston. It also contributes to demand for large fulfillment centers in suburban locations. Moreover, large brick-and-mortar retailers that avoided bankruptcy are beginning to adapt to this fundamental shift in the distribution of final sales, such as creating their own online experiences and embracing omnichannel distribution. These retailers will also contribute to demand for local last-mile industrial space and suburban fulfillment centers.
These factors have contributed to demand for commercial real estate as a hard asset, and to particularly strong demand for industrial space. As recently noted by Real Capital Analytics, 2019 industrial deal activity as a whole was greater than in 2018, driven by major portfolio sales and acquisitions.2 In light of trade tensions between the U.S. and China, Canada remains the major source of international capital deployed to U.S. commercial real estate. Additionally, the full ratification of the United States-Mexico-Canada Agreement (USMCA) will bolster economic activity. Finally, cap rates by asset class are lower now than just prior to the 2008-2009 global financial crisis. These events suggest net absorption of industrial space will remain steady in the near term, especially as e-commerce providers continue to address distribution challenges for purchases and returns.
Key Inputs and Disclaimers
The forecast is based on a process that involves testing more than 40 economic and real estate variables that theoretically relate to demand for industrial space, including varying measures of employment, GDP, exports and imports, and air, rail and shipping data. Leading indicators that factor heavily into the model include the Federal Reserve Board’s Index of Manufacturing Output (IMO), the Purchasing Managers Index (PMI) from the Institute of Supply Management (ISM) and net absorption data from CBRE Econometric Advisors.
ISM, the Federal Reserve and CBRE Econometric Advisors assume no responsibility for the Forecast. The absorption forecast tracks with CBRE data and may vary when compared with other data sets. Data includes warehouse, distribution, manufacturing, R&D and special purpose facilities with rentable building areas of 10,000 square feet or more.
Download the NAIOP Industrial Space Demand model (2011) for a full description of the model and methodology.
Actual Versus Forecast
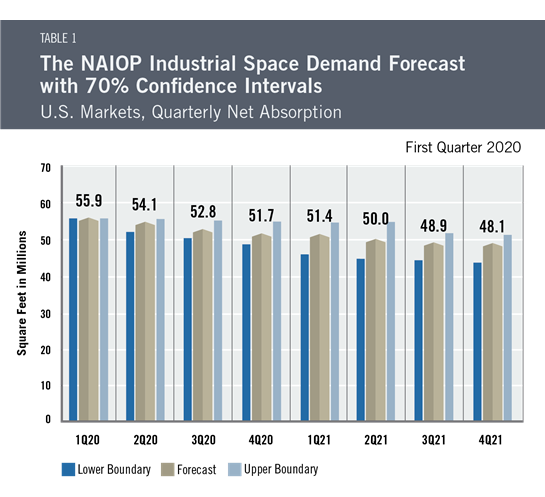
Net absorption in 2019 was lower than in the previous year, perhaps reflecting supply constraints and increased caution in response to global events (see Table 2). During 2019, 183.3 million square feet of industrial space was absorbed, in line with the forecast of 189.1 million square feet.