


Industrial Space Demand Forecast, First Quarter 2018
Release Date: February 2018
Industrial Demand to Remain Strong as Market Becomes Undersupplied
Demand for U.S. industrial space is expected to remain robust and steady throughout 2018, with quarterly net absorption forecast to average 55.6 million square feet. This is higher than the 44.1 million square feet of actual net absorption, on average per quarter, recorded in 2017, but lower than the 60 million square feet of quarterly net absorption forecast six months ago. According to Dr. Hany Guirguis, Manhattan College, and Dr. Joshua Harris, New York University, the predicted increase over 2017 figures is due to the faster and broader macroeconomic growth and increased consumer spending expected in 2018.
The model, run on a quarterly basis, forecasts slightly lower industrial space demand in 2019, when inflation and interest rates are expected to rise, moderating growth. U.S. gross domestic product grew by 2.6 percent in the fourth quarter of 2017, according to the advance estimate released by the U.S. Bureau of Economic Analysis, and by 2.3 percent for all of 2017. (For comparison, U.S. GDP grew by just 1.5 percent in 2016.) Sustained growth, especially with low unemployment at 4.1 percent as of January 2018, will translate into increasing demand for industrial properties as industrial users see more justification for investment and expansion of facilities.
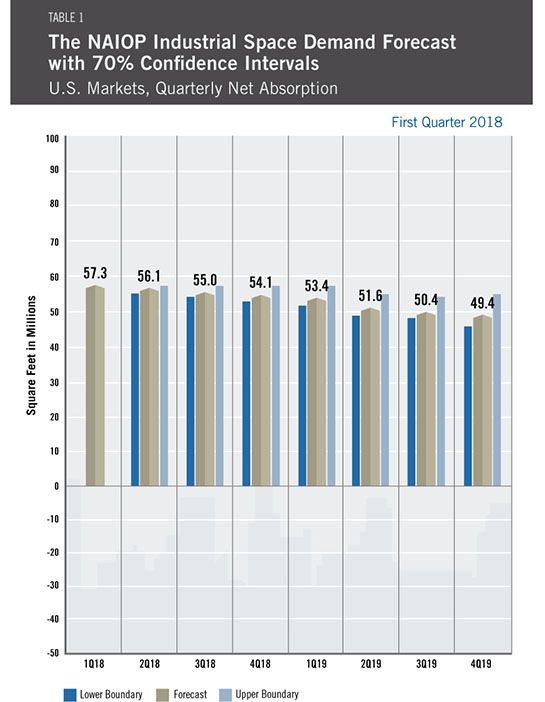
Despite strong demand for industrial space, net absorption lagged behind the prior forecast. The data suggest that the root cause of this underperformance is lack of new supply. Thus, the only way for the industrial market to realize its full potential in 2018 is for additional new product to be delivered.
Space constraints are not likely the only hurdle to impede firms that use industrial space. Shortages of skilled labor are also an issue. An unemployment rate of 4.1 percent means fewer skilled workers are available for hire; this is likely slowing the rate of new hiring. The most comprehensive measure of labor underutilization, labeled U-6 by the federal Bureau of Labor Statistics, is known as the underemployment rate. It has fallen from 9.1 percent at the end of 2016 to 8.2 percent as of January 2018, the lowest reading of this measure since 2007.
The factor with the greatest potential to influence the economy in the coming years is the new federal tax law. This tax code is so new that its impacts are not yet reflected in the indicators used in this model. The lower corporate and pass-through tax rates, accelerated depreciation of equipment, lower rates on repatriated profits and other provisions should leave industrial tenants with more cash for expansion of production capabilities and facilities. Given rising broad-based demand worldwide, there is good reason to expect this will occur. Further, most U.S. consumers will see higher after-tax incomes, even in those states where limitations on state and local tax deductions will have a greater impact. As a result, consumer spending is likely to increase, generating more demand for manufacturing and warehouse/distribution facilities. The fact that e-commerce merchants are the dominant new users of industrial space will likely result in more direct connections between consumer financial health and net industrial demand.
Key Inputs and Disclaimers
The predictive model is funded by the NAIOP Research Foundation and was developed by Guirguis and Dr. Randy Anderson, formerly of the University of Central Florida. The model, which forecasts demand for industrial space at the national level, utilizes variables that comprise the entire supply chain and lead the demand for space, resulting in a model that is able to capture the majority of changes in demand.
While leading economic indicators have been able to forecast recessions and expansions, the indices used in this study are constructed to forecast industrial real estate demand expansions, peaks, declines and troughs. The Industrial Space Demand model was developed using the Kalman filter approach, where the regression parameters are allowed to vary with time and thus are more appropriate for an unstable industrial real estate market.
The forecast is based on a process that involves testing more than 40 economic and real estate variables that theoretically relate to demand for industrial space, including varying measures of employment, GDP, exports and imports, and air, rail and shipping data. Leading indicators that factor heavily into the model include the Federal Reserve Board’s Index of Manufacturing Output (IMO), the Purchasing Managers Index (PMI) from the Institute of Supply Management (ISM) and net absorption data from CBRE Econometric Advisors.
ISM, the Federal Reserve and CBRE Econometric Advisors assume no responsibility for the Forecast. The absorption forecast tracks with CBRE data and may vary when compared with other data sets. Data includes warehouse, distribution, manufacturing, R&D and special purpose facilities with rentable building areas of 10,000 square feet or more.
Actual Versus Forecast
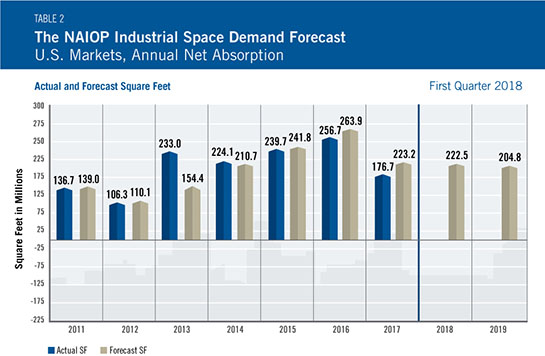
Despite strong demand for industrial space, net absorption lagged behind the forecast. The data suggest that the root cause of this underperformance was lack of new supply. The national vacancy rate for industrial properties peaked at 14.1 percent in 2010, then declined steadily, starting in 2011, to a current rate of 7.4 percent, which has held since the third quarter of 2016. In all four quarters of 2017, delivery of new space was almost equal to net absorption, so vacancy stayed flat.
Initial and Ongoing Research
In 2009, the NAIOP Research Foundation awarded a research grant to Anderson and Guirguis to develop a model for forecasting net absorption of industrial space in the United States. That model led to successful forecasting two quarters out. A white paper describing the research and testing behind the model for NAIOP’s Industrial Space Demand Forecast is available at naiop.org/researchfoundation.
The model was revised in 2012 to forecast eight quarters out. For this longer term forecast, Guirguis and Harris utilize the average central tendency forecast of the unemployment rate and growth rate of real GDP, provided by the seven members of the Board of Governors and the 12 presidents of the Federal Reserve Banks during the most recent Federal Open Market Committee meeting. Their forecasts are the independent variables in the equations. The forecasts usually vary from one year to another, so different techniques are applied to convert the yearly forecast to a quarterly one, in order to create the quarterly forecasts for net absorption. The estimated coefficients on the independent variables are estimated with the time-varying Kalman filter.
