


Industrial Space Demand Forecast, Third Quarter 2020
Release Date: August 2020
LISTEN TO THE WEBINARThe forecast's authors discussed what factors contributed to the forecast's projected decline, when demand could rebound, and other implications for the industrial real estate sector in a special webinar Aug. 27. Members can listen to the webinar on-demand at no cost (use member login to access); nonmembers can purchase the webinar recording. |
COVID-19 Spurs Demand for E-Commerce, but Recession Produces Headwinds for Industrial Real Estate
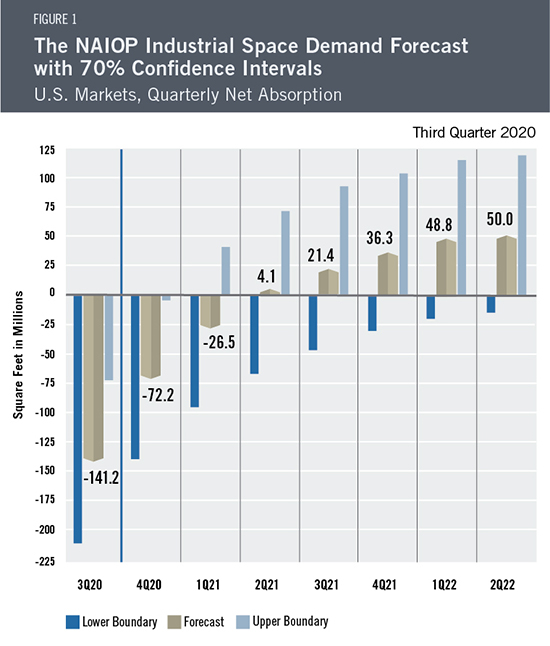
The U.S. macroeconomic landscape has deteriorated significantly since NAIOP’s February 2020 Industrial Space Demand Forecast. Most notably, the economy entered a recession that is likely to continue through the end of the year. Although industrial real estate has outperformed other commercial property types this year due to a surge in e-commerce, broader macroeconomic indicators suggest industrial space absorption will decline sharply in Q3 2020 and then rebound to positive levels in Q2 2021 (see Figure 1).
After spreading quickly within the New York tri-state area, the COVID-19 pandemic moved south and west to states such as Arizona, Florida and Texas. As of mid-August, U.S. states and municipalities continue to implement a patchwork of public safety orders and partial lockdowns on business activity. Solutions to this crisis depend on the development and distribution of a successful vaccine; three candidate vaccines will soon enter large-scale trials.
Prior to the pandemic, CRE was already being disrupted by several major economic trends, in particular the growth of e-commerce. In part, this was driven by the economic efficiency of e-commerce distribution over traditional brick-and-mortar retail.1 The pandemic will likely accelerate the transition of retail sales online, which will continue to drive long-term demand for industrial space. In urban and suburban communities, same-day and next-day delivery through e-commerce will support industrial absorption. The automation of physical tasks within warehouses and distribution centers has the potential to increase their efficiency, further contributing to e-commerce’s competitive advantage over traditional retail.2
Although the pandemic will likely increase demand for e-commerce, it is unlikely that industrial real estate will be completely immune from the effects of the coronavirus-induced recession. These include significant disruptions to supply chains and global trade, reduced manufacturing and construction activity, and widespread store closures among brick-and-mortar retailers. These trends and the overall decline in economic activity are likely to impair the performance of industrial properties that are not well-positioned for e-commerce distribution. Employment in U.S. warehousing and storage in July remained 2.3% lower than its peak in March, suggesting that while the sector has fared better than the economy as a whole, it is still recovering.3
Several indicators present challenging conditions for industrial real estate. First-time (or new) unemployment insurance claims, a weekly measure, are near 1 million (claims peaked at more than 6.8 million in the early days of the pandemic).4 Moreover, market expectations of long-term inflation, as measured by the 10-year breakeven inflation rate, remain nearly 50 basis points (bps) below the Federal Reserve’s stated long-term inflation target of 2%.5 Since August 2019, the Fed has expanded its balance sheet by nearly 60% to over $6.5 trillion.6
While equity markets have largely recovered, the 10-year U.S. Treasury yield remains at historic lows, having fallen below 100 bps. As a precautionary measure, investors have moved to cash. Total assets in money-market funds are near $4.5 trillion, exceeding levels last seen during the global financial crisis of 2007-2009.7
The Q2 2020 contraction in Gross Domestic Product (GDP), if annualized, was nearly 33%, rivaling the early years of the Great Depression. The yield curve, the difference between long- and short-term interest rates and a bellwether of forward-looking expectations of economic growth, has been below 50 bps (or negative) since January 2019.8 Moreover, real-time indicators of economic activity, as well as academic forecasts of growth, highlight the headwinds currently facing the U.S. economy.9
Given these unprecedented challenges, industrial net absorption is forecast to decline to negative 141 million square feet in Q3 2020.10 Net absorption is forecast to remain negative after Q3, with negative absorption of approximately 72 million square feet in Q4 2020 and 27 million square feet in Q1 2021. The forecast calls for a return to positive net absorption by Q2 2021. Growth in industrial absorption consistent with pre-pandemic trends, however, is not forecast to resume until Q1 2022.
For Q3 and Q4 2020, this forecast assumes real GDP will contract by approximately 1.4% per quarter. It also assumes slow economic expansion with forecast real GDP growth of roughly 1.25% for each quarter in 2021, but quarterly growth of less than 1% for Q1 and Q2 2022. Effects on employment and inflation are likely to outlast the recession itself. The forecast assumes the average unemployment rate to be 9.3% for 2020, 6.5% for 2021 and 5.5% for 2022. Inflation, as measured by the deflator of Personal Consumption Expenditures, is estimated to be 1% for 2020, 1.5% for 2021 and 1.7% for 2022.
The model that informs this forecast draws from historical data on the economy and industrial real estate absorption to project future demand. However, since global pandemics are very rare, current economic conditions are not easily comparable with most periods for which data are available.
To address the challenges of limited data and uncertainty about the trajectory of the economy, this forecast allows for much larger error bounds than previous absorption forecasts (see Figure 1). The upper bound absorption estimate reflects conditions in an optimistic scenario, in which the pandemic is effectively contained and economic policy errors are avoided. Alternatively, the lower bound may be viewed as a pessimistic scenario in which the pandemic intensifies or policy errors depress economic activity. See the Key Inputs and Disclaimers section for more information on the data used to develop this forecast.
Actual Versus Forecast
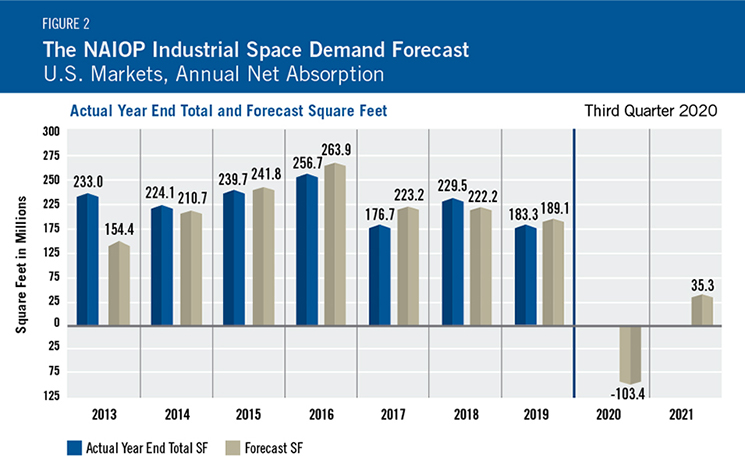
Net absorption in 2019 was lower than in the previous year, perhaps reflecting supply constraints and increased caution in response to global events (see Figure 2). During 2019, 183.3 million square feet of industrial space was absorbed, in line with the forecast of 189.1 million square feet.
Key Inputs and Disclaimers
The predictive model is funded by the NAIOP Research Foundation and was developed by Guirguis and Dr. Randy Anderson, formerly of the University of Central Florida. The model, which forecasts demand for industrial space at the national level, utilizes variables that comprise the entire supply chain and lead the demand for space, resulting in a model that is able to capture the majority of changes in demand.
While leading economic indicators have been able to forecast recessions and expansions, the indices used in this study are constructed to forecast industrial real estate demand expansions, peaks, declines and troughs. The Industrial Space Demand model was developed using the Kalman filter approach, where the regression parameters are allowed to vary with time and thus are more appropriate for an unstable industrial real estate market.
The forecast is based on a process that involves testing more than 40 economic and real estate variables that theoretically relate to demand for industrial space, including varying measures of employment, GDP, exports and imports, and air, rail and shipping data. Leading indicators that factor heavily into the model include the Federal Reserve Board’s Index of Manufacturing Output (IMO), the Purchasing Managers Index (PMI) from the Institute of Supply Management (ISM) and net absorption data from CBRE Econometric Advisors.
Authors
Hany Guirguis, Ph.D., Professor, Economics and Finance, Manhattan College
Timothy Savage, Ph.D., Clinical Assistant Professor, Schack Institute of Real Estate, New York University
Media Inquiries
Please contact Kathryn Hamilton, vice president for marketing and communications, at hamilton@naiop.org.
1 Bill Wheaton, “Bricks Versus Clicks: Which Retail Channel is Most Efficient?” MIT Center for Real Estate, February, 2019,
https://mitcre.mit.edu/news/blog/bricks-versus-clicks-retail-channel-efficient.
2 Timothy Savage, “Disruption from Automation,” CBRE Econometric Advisors’ Client Conference, 2016.
3 “Employment, Hours, and Earnings from the Current Employment Statistics Survey (National),” U.S. Bureau of Labor Statistics,
https://data.bls.gov/timeseries/CES4349300001?amp%253bdata_tool=XGtable&output_view=data&include_graphs=true.
4 “Unemployment Insurance Weekly Claims,” U.S. Department of Labor Employment and Training Administration, August 13, 2020, https://www.dol.gov/ui/data.pdf; By comparison, during the GFC, the highest claims were approximately 800,000 per week.
5 “10-Year Breakeven Inflation Rate (T10YIE),” FRED Economic Data, Federal Reserve Bank of St. Louis, https://fred.stlouisfed.org/series/T10YIE.
6 “Assets: Total Assets: Total Assets (Less Eliminations from Consolidation): Wednesday Level (WALCL),” FRED Economic Data, Federal Reserve Bank of St. Louis, https://fred.stlouisfed.org/series/WALCL.
7 “Money Market Funds; Total Financial Assets, Level (MMMFFAQ027S)” FRED Economic Data, Federal Reserve Bank of St. Louis,
https://fred.stlouisfed.org/series/MMMFFAQ027S.
8 “10-Year Treasury Constant Maturity Minus 3-Month Treasury Constant Maturity (T10Y3M),” FRED Economic Data, Federal Reserve Bank
of St. Louis, https://fred.stlouisfed.org/series/T10Y3M; Seminal research by Duke University professor Campbell Harvey indicates that a
negative yield curve is a near-perfect predictor of economic recession. See Campbell R. Harvey, “Forecasts of Economic Growth from the Bond and Stock Markets,” Financial Analysts Journal 45, no. 5 (September-October, 1989): 38-45, https://doi.org/10.2469/faj.v45.n5.38.
9 “Eight High Frequency Indicators for the Economy,” Calculated Risk, August 17, 2020, https://www.calculatedriskblogcom/2020/08/ eight-high-frequency-indicators-for.html; “FiveThirtyEight/IGM COVID-19 Economic Outlook Survey Series, Round 6,” IGM Forum, The University of Chicago Booth School of Business, August 10, 2020, www.igmchicago.org/wp-content/uploads/2020/08/Results-Round-06.pdf. Industry growth forecasts are more optimistic.See “Third Quarter 2020 Survey of Professional Forecasters,” Federal Reserve Bank of Philadelphia, August 14, 2020, https://www.philadelphiafed.org/research-and-data/real-time-center/survey-of-professional-forecasters/2020/survq320.
10 While a dramatic decline, it should be noted that the stock of industrial space tracked by CBRE Econometric Advisors currently stands
at 14.4 billion square feet, an increase of nearly 12% since the end of the global financial crisis in March 2009.
