

Industrial Space Demand Forecast, Third Quarter 2017
Release Date: August 2017
Demand for Industrial Space Will Remain Robust
After a slow start in the first quarter of 2017, the U.S. economy appears to be back in expansion mode with GDP growing at an annualized rate of 2.6 percent in the second quarter. Job creation has averaged about 195,000 net new jobs per month throughout this year and unemployment has settled near all-time lows at 4.3 percent as of July 2017.
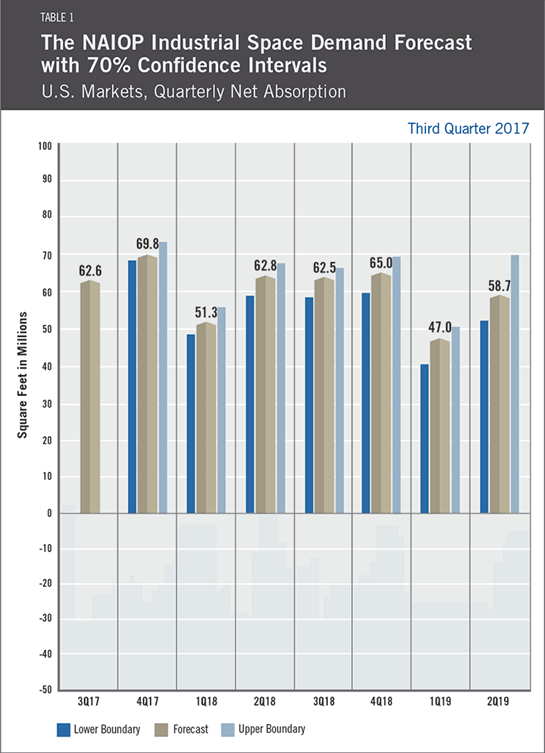
The model, run quarterly by Dr. Hany Guirguis, Manhattan College, and Dr. Joshua Harris, New York University, suggests that net absorption of industrial space could increase slightly over the forecast released six months ago to 66 million square feet per quarter for the second half of 2017 and to roughly 60 million square feet per quarter in 2018.
According to the model, the potential for a slowdown in net absorption due to a stall in macroeconomic activity is now pushed into 2019 at the earliest; however, this is open to further outward revision if the economy continues to grow at a pace above the current forecast. Given the uncertainty regarding policy changes in Washington, all forecasts for economic activity, and even industrial space demand, deserve a special caveat. Right now, the broad markets — measured by proxy through stock prices and consumer and CEO confidence — are quite positive about future expectations relating to regulatory and possibly tax reform. If those positive expectations change, the economy could cool off suddenly and thus demand for industrial space could decline.
At this point, it appears the first quarter was an anomaly relative to both GDP and employment growth due to the unexpected presidential election of Donald Trump. The election result caught many market participants off guard and thus it appears that decisions about investments and expansions were delayed temporarily. Overall, market consensus seems to be that the latter half of 2017 may benefit from a release of pent-up demand. The debate about peak pricing in commercial real estate will only continue; however, space market fundamentals, especially in the industrial market, are only likely to improve as the overall economy expands. Rising construction prices and labor shortages will likely moderate generation of new supply, even with rising economic growth, but will likely help rental rates and pricing continue to increase.
While the future of the economy and the effectiveness of the current U.S. President are likely to remain open for debate, there is little question that demand for industrial real estate will remain strong. While stories about the “death of retail” are assuredly overblown — with REIS reporting recent quarters of positive net absorption of retail space and the U.S. Census Bureau posting all-time record highs in retail sales — it is increasingly clear that more physical goods will pass through multiple distribution warehouses before reaching consumers’ hands.
Further, based on data supplied by the Institute for Supply Management showing that new orders are growing and on U.S. Census Bureau data illustrating that orders for durable goods are rising, manufacturing activity still appears to be increasing steadily in the U.S. as of the second quarter of 2017; while this activity will require fewer jobs due to automation, it will still require more industrial facilities, further underpinning demand for industrial real estate.
Key Inputs and Disclaimers
The predictive model is funded by the NAIOP Research Foundation and was developed by Guirguis and Dr. Randy Anderson, formerly of the University of Central Florida. The model, which forecasts demand for industrial space at the national level, utilizes variables that comprise the entire supply chain and lead the demand for space, resulting in a model that is able to capture the majority of changes in demand.
While leading economic indicators have been able to forecast recessions and expansions, the indices used in this study are constructed to forecast industrial real estate demand expansions, peaks, declines and troughs. The Industrial Space Demand model was developed using the Kalman filter approach, where the regression parameters are allowed to vary with time and thus are more appropriate for an unstable industrial real estate market.
The forecast is based on a process that involves testing more than 40 economic and real estate variables that theoretically relate to demand for industrial space, including varying measures of employment, GDP, exports and imports, and air, rail and shipping data. Leading indicators that factor heavily into the model include the Federal Reserve Board’s Index of Manufacturing Output (IMO), the Purchasing Managers Index (PMI) from the Institute of Supply Management (ISM) and net absorption data from CBRE Econometric Advisors.
ISM, the Federal Reserve and CBRE Econometric Advisors assume no responsibility for the Forecast. The absorption forecast tracks with CBRE data and may vary when compared with other data sets. Data includes warehouse, distribution, manufacturing, R&D and special purpose facilities with rentable building areas of 10,000 square feet or more.
Actual versus Forecast
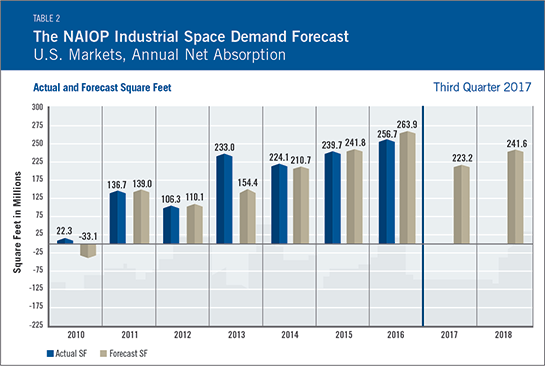
While increased industrial space demand is forecast for the second half of 2017, net absorption in the first half came in below the first quarter forecast, posting 92 million square feet of net absorption compared to the expected level of 123 million square feet. This was due largely to a lower than expected net absorption figure in the first quarter (58 million square feet forecast versus 34 million square feet actually absorbed). First quarter underperformance was observed in many macroeconomic and commercial real estate variables including sales volume and pricing.
Initial and Ongoing Research
In 2009, the NAIOP Research Foundation awarded a research grant to Anderson and Guirguis to develop a model for forecasting net absorption of industrial space in the United States. That model led to successful forecasting two quarters out. A white paper describing the research and testing behind the model for NAIOP’s Industrial Space Demand Forecast is available at naiop.org/research.
The model was revised in 2012 to forecast eight quarters out. For this longer term forecast, Guirguis and Harris utilize the average central tendency forecast of the unemployment rate and growth rate of real GDP, provided by the seven members of the Board of Governors and the 12 presidents of the Federal Reserve Banks during the most recent Federal Open Market Committee meeting. Their forecasts are the independent variables in the equations. The forecasts usually vary from one year to another, so different techniques are applied to convert the yearly forecast to a quarterly one, in order to create the quarterly forecasts for net absorption. The estimated coefficients on the independent variables are estimated with the time-varying Kalman filter.
