


Office Space Demand Forecast, Fourth Quarter 2019
Release Date: November 2019
Office Leasing Activity to Sustain Momentum as U.S. Economic Expansion Continues
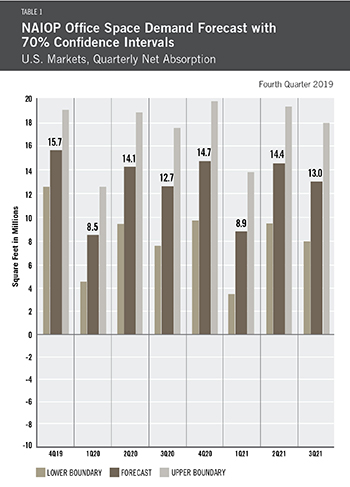
The U.S. office market continues to perform as expected, with an average of 14.7 million square feet absorbed per quarter in 2019. Overall employment growth remains steady and is especially robust in the key office-using sector of Professional and Business Services, according to the U.S. Department of Labor’s Bureau of Labor Statistics.
As such, the forecast for the remainder of 2019 and 2020 remains strong at an average of 13.2 million square feet absorbed per quarter in 2020 and 12.7 million square feet per quarter in 2021. Continued, yet slowed, macroeconomic and job growth is factored into this forecast; if GDP growth were to slow significantly from its current 1.9% level or if unemployment were to spike considerably from its current 3.6% level, actual office leasing activity could fall substantially. At present, the economy — and thus the office markets — are expected to remain in an upcycle for at least the next 18 months.
 Beyond the macroeconomy, there are significant concerns regarding the recent failed IPO of WeWork and its suspension of leasing activity amid a cash crunch. According to research from CBRE and Cushman & Wakefield, of the 70 million square feet of office space nationally that is leased for coworking, WeWork has leases on approximately 11 million square feet. However, these properties are not spread evenly across the U.S.; more of them are in urban markets such as New York City and San Francisco. Therefore, the effects of the WeWork situation are likely to be isolated to a small set of markets and will not broadly impact the national office market. The company’s inability to expand may generate more demand for direct leases in some markets, but overall, coworking appears to be a long-term trend, and the forecast will likely resist any short-term impacts caused by WeWork’s recent troubles.
The greater risk to the U.S. office market is from a recession. Recent data indicates that the chances of one occurring by the end of 2021 may have risen. GDP growth has slowed from above 3.0% to 1.9%, and the Conference Board’s measure of CEO Confidence has fallen to its lowest level since early 2009 — a reading of 34 in Q3, down from 43 in Q2 (any reading below 50 indicates negative expectations). Global slowdown risks, excessive corporate debt and geopolitical threats continue to loom over domestic economic strength. Firms might slow their expansion plans in 2020, reducing the need for new office space, in reaction to overall fears of a slowdown. Still, most measures of consumer health, including wage growth, job growth and consumption expenditures, remain strong.
Key Inputs and Disclaimers
In January 2016, the NAIOP Research Foundation published “Forecasting Office Space Demand,” a model that forecasts net absorption of U.S. office space on a quarterly basis for eight consecutive quarters. Created by researchers Hany Guirguis, Ph.D., and Joshua Harris, Ph.D., CRE, CAIA, the model is similar to that used for the NAIOP Industrial Space Demand Forecast, which successfully projected a drop and rebound in net absorption of industrial space in 2009 and 2010. Below are the leading, coincident and lagging variables used in the office space demand forecast.
- The growth rate in real gross domestic product (GDP) captures the broadest level of macroeconomic activity, reflecting the value of all goods and services produced in a given year.
- Corporate profits of domestic industries directly captures the financial capacity and growth of firms that may need to expand. Profits are a source of retained earnings, so they provide a clue about how much money is available to fund investments in plants and equipment, an investment activity that raises productive capacity.
- Total employment in the financial services sector is a direct measure and proxy for office-using employment that best fits with changes in office space demand.
- Two variables from the Institute for Supply Management’s Non-Manufacturing Indices serve as proxies for a sentiment measure on the future health of office-using firms. The ISM-NM Inventories Index measures increases and decreases in inventory levels, while the ISM-NM Supplier Deliveries Index measures how long it takes suppliers to deliver parts and materials that are integral to service sector businesses.
These five measures — along with the lagged measures of net absorption of office space, which serve as the base of the model — make possible an accurate two-year forecast of net absorption of office space nationwide. The methods used in the forecast are dynamic rather than static, to account for the changing nature of the underlying macro economy.
Office absorption data are provided by CBRE Econometric Advisors, which assumes no responsibility for this forecast. The absorption forecast tracks with CBRE office data and may vary when compared to other data sets. Data include office buildings in the U.S. with a minimum rentable building area that ranges from 10,000 to 150,000 square feet, depending on the market.
This forecast is based on third-quarter 2019 data.
Actual versus Forecast
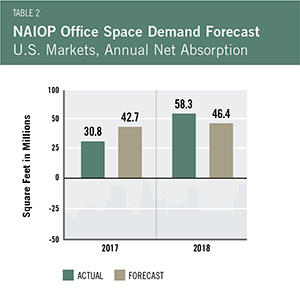
Table 2 compares the forecast to actual net absorption. The forecast for 2018 was 46.4 million square feet, which is 11.9 million square feet less than the 58.3 million square feet that were actually absorbed for the year. CBRE revised upward the 2018 net absorption figures during the year. Lagged net absorption is a significant variable in the NAIOP Office Space Demand Forecast, so this restatement had significant impacts on the calculation of the fourth quarter 2018 forecast total (11.6 million square feet on average per quarter for 2018) compared to the prior forecast issued in the second quarter of 2018 (8.4 million square feet on average per quarter).
The NAIOP Office Space Demand Forecast is published in the second and fourth quarters of each year by the NAIOP Research Foundation
.