


Office Space Demand Forecast, Fourth Quarter 2018
Release Date: November 2018
Resurgence in Office Leasing: Breakout Economic Growth Forecasts Higher Rates of Net Absorption
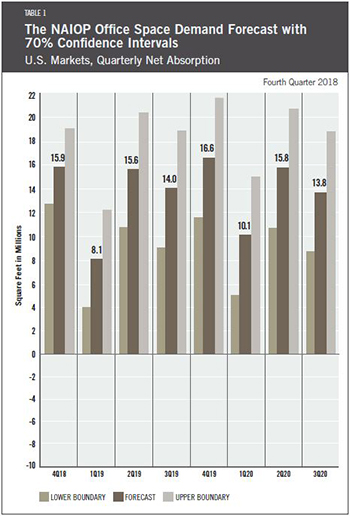
The U.S. office market posted solid net absorption levels in the second and third quarters of 2018 of 18.0 million and 11.0 million square feet, respectively. This level of new leasing is likely due to higher-than-expected economic growth and the subsequent demand brought about by jobs created in the office-using sectors.
Due to third quarter 2018 U.S. GDP growth of 3.5 percent and a current unemployment rate of 3.7 percent, 2018 is expected to register nearly 13.0 million square feet of net absorption per quarter, significantly outpacing 2017 and 2016 when the quarterly figures averaged 9.5 million and 10.4 million square feet, respectively. The forecast is strongly dependent on continued annual economic growth near 3.0 percent, which seems plausible for all of 2019 and into 2020 given current data.
 The strength of the U.S. economy is evident in several economic indicators including the U.S. Census Bureau Advance Monthly Sales for Retail and Food Services report, the U.S. Census Bureau Durable Goods report and the growth in private non-residential fixed investment as measured by the U.S. Bureau of Economic Analysis. The current macroeconomic expansion will most likely continue beyond next summer, which will officially make it the longest sustained economic growth period in U.S. history.
However, the biggest limitation to the expansion of firms that use office space is likely to be the ability to hire qualified employees. According to the Bureau of Labor Statistics, new job openings are now growing at an annualized rate of 4.6 percent, up from 3.6 percent a year ago; total job openings reached an all-time high of 7.1 million, up from just over 6.0 million a year ago. The total number of job openings exceeded the total number of unemployed persons earlier this year for the first time in the history of collecting such data in the U.S. Thus, the authors predict that firms will face expansion challenges despite rising market demands in 2019.
Due to the labor shortage, wage growth will contribute to overall inflation and interest rates will likely continue to increase, with rising interest rates moderating economic activity over the next two years. Regarding office space demand, the ultimate determinant of long-term growth will be how the business sector reacts to rising wages and interest rates. Federal Reserve Board projections of GDP suggest that current levels of economic growth will be sustained as firms bow to competitive pressures and expand. The most plausible event to disrupt this scenario would be worsening geopolitical instability.
Key Inputs and Disclaimers
In January 2016, the NAIOP Research Foundation published “Forecasting Office Space Demand,” a model that forecasts net absorption of U.S. office space on a quarterly basis for eight consecutive quarters. Created by researchers Hany Guirguis, Ph.D., of Manhattan College and Joshua Harris, Ph.D., CRE, CAIA, of New York University, the model is similar to that used for the NAIOP Industrial Space Demand Forecast, which successfully projected a drop and rebound in net absorption of industrial space in 2009 and 2010. (The industrial space demand model was created by Guirguis along with Randy Anderson, Ph.D., then at the University of Central Florida.) Below are the leading, coincident and lagging variables used in the office space demand forecast.
- The growth rate in real gross domestic product (GDP) captures the broadest level of macroeconomic activity, reflecting the value of all goods and services produced in a given year.
- Corporate profits of domestic industries directly captures the financial capacity and growth of firms that may need to expand. Profits are a source of retained earnings, so they provide a clue about how much money is available to fund investments in plant and equipment, an investment activity that raises productive capacity.
- Total employment in the financial services sector is a direct measure and proxy for office-using employment that best fits with changes in office space demand.
- Two variables from the Institute for Supply Management’s Non-Manufacturing Indices serve as proxies for a sentiment measure on the future health of office-using firms. The ISM-NM Inventories Index measures increases and decreases in inventory levels, while the ISM-NM Supplier Deliveries Index measures how long it takes suppliers to deliver parts and materials that are integral to service sector businesses.
These five measures — along with the lagged measures of net absorption of office space, which serve as the base of the model — make possible an accurate two-year forecast of net absorption of office space nationwide. The methods used in the forecast are dynamic rather than static, to account for the changing nature of the underlying macro economy.
Office absorption data are provided by CBRE Econometric Advisors, which assumes no responsibility for this forecast. The absorption forecast tracks with CBRE office data and may vary when compared to other data sets. Data include office buildings in the U.S. with a minimum rentable building area that ranges from 10,000 to 150,000 square feet, depending on the market.
Actual versus Forecast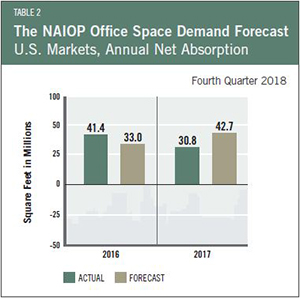
First quarter 2018 net absorption figures were revised upward by CBRE between the second and third quarters of this year. Lagged net absorption is a significant variable in the NAIOP Office Space Demand Forecast, so this restatement has significant impacts on the calculation of this fourth quarter 2018 forecast (13.0 million square feet on average per quarter for 2018) compared to the prior forecast issued in the second quarter of 2018 (8.4 million square feet on average per quarter for the remaining three quarters of 2018).
This forecast is based on third quarter 2018 data.