


Office Space Demand Forecast, Fourth Quarter 2016
Release Date: November 2016
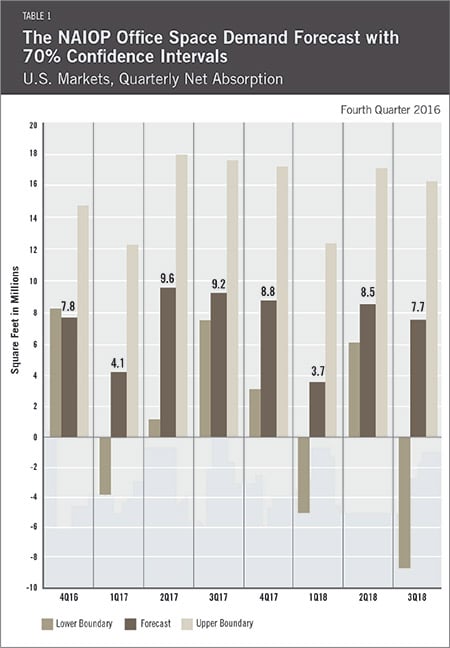
Net Absorption of Office Space Forecast to Decline but Expected to Remain Positive
As the final quarter of 2016 unfolds, Dr. Hany Guirguis, Manhattan College, and Dr. Joshua Harris, University of Central Florida, project that the U.S. office market will post approximately 33.0 million square feet of positive net absorption for the year.
Over the coming eight quarters, net absorption is projected to range between 3.7 and 9.6 million square feet each quarter, down from the quarterly range of the previous forecast, which was 8.4 to 13.1 million square feet. This lower range is due predominantly to increased variance in two of the model’s five key variables: GDP and office-using employment.
The U.S. economy expanded through most of 2016. The first estimate of third-quarter GDP growth registered an annualized rate of 2.9 percent, the highest reading in more than a year. Still, GDP is not likely to grow by more than 2.0 percent for the year. As core inflation has been at or near 2.0 percent for several years, the probability is very high that the Federal Reserve Board will increase key rates at a faster pace, beginning in December.
The net effect of rising rates and slow overall growth have led to a 2017 net absorption forecast of roughly 32.0 million square feet, very similar to the 2016 level. What is noteworthy about this forecast is the increased variance of the upper and lower boundaries of the confidence intervals, which indicate that sporadic quarters of negative absorption are possible in 2017, though not very likely.
Overall, the office sector is better positioned for expansion than some of the other real estate sectors. Office-using employment growth has continued at a robust pace, and both the model and consensus forecasts project that this will continue. Overall, year-over-year, non-farm employment in the U.S. grew at an average monthly rate of 1.7 percent between May and September 2016, compared to all office-using employment sectors, which averaged 2.4 percent growth over the same period.
Among office-using jobs, two NAICS Supersectors — “Professional and Business Services” and “Financial Activities”— have been the strongest, with average year-over-year growth rates (i.e. May to May, June to June, etc.) between May and September 2016, of 2.8 and 2.0 percent, respectively. Barring unforeseen circumstances, the model assumes that this job growth will continue and should support positive net absorption of office space. Still, the risk of a downturn in the macro economy is arguably higher today than it has been in recent years, but the risk of a true recession remains relatively low. Moving forward, it will be critical to monitor interest rates, as sudden spikes could harm corporate profits, which would likely reduce hiring in the office sectors and thus demand for office space.
Key Inputs and Disclaimers
In January 2016, the NAIOP Research Foundation published “Forecasting Office Space Demand,” a model that forecasts net absorption of U.S. office space on a quarterly basis for eight consecutive quarters. Created by researchers Hany Guirguis, Ph.D., of Manhattan College and Joshua Harris, Ph.D., CRE, CAIA, of the University of Central Florida, the model is similar to that used for the NAIOP Industrial Space Demand Forecast, which successfully projected a drop and rebound in net absorption of industrial space in 2009 and 2010. (The industrial space demand model was created by Guirguis along with Randy Anderson, Ph.D., of the University of Central Florida.) Below are the leading, coincident and lagging variables used in the office space demand forecast.
- The growth rate in real gross domestic product (GDP) captures the broadest level of macroeconomic activity, reflecting the value of all goods and services produced in a given year.
- Corporate profits of domestic industries directly captures the financial capacity and growth of firms that may need to expand. Profits are a source of retained earnings, so they provide a clue about how much money is available to fund investments in plant and equipment, an investment activity that raises productive capacity.
- Total employment in the financial services sector is a direct measure and proxy for office-using employment that best fits with changes in office space demand.
- Two variables from the Institute for Supply Management’s Non-Manufacturing Indices serve as proxies for a sentiment measure on the future health of office-using firms. The ISM-NM Inventories Index measures increases and decreases in inventory levels, while the ISM-NM Supplier Deliveries Index measures how long it takes suppliers to deliver parts and materials that are integral to service sector businesses.
These five measures — along with the lagged measures of net absorption of office space, which serve as the base of the model — make possible an accurate two-year forecast of net absorption of office space nationwide. The methods used in the forecast are dynamic rather than static, to account for the changing nature of the underlying macro economy.
Office absorption data are provided by CBRE Econometric Advisors, which assumes no responsibility for this forecast. The absorption forecast tracks with CBRE office data and may vary when compared to other data sets. Data include office buildings in the U.S. with a minimum rentable building area that ranges from 10,000 to 150,000 square feet, depending on the market.
Actual versus Forecast
Because this is the second forecast in this series, it is not yet possible to compare forecast with actual net absorption on an annual basis. The next report will begin to publish this data.