Construction Costs Outlook

After a brief retreat, outlays for materials are poised to increase; meanwhile, compensation for workers continues to climb.
Construction cost increases slowed, and in some cases reversed course, during the past few months after accelerating steeply in the first half of 2018. But property owners and developers may find the relief is short-lived as the pressures that drove costs higher have not disappeared.
The Bureau of Labor Statistics (BLS) posts two sets of indicators each month that are helpful for tracking construction costs. The first, average hourly earnings, tracks wages and salaries for all construction industry employees. It’s part of the employment report that appears on the first or second Friday of each month. Around mid-month, BLS issues producer price indexes (PPIs) for specific materials, weighted averages of all goods and services used in construction, and prices charged by contractors.
BLS creates the last of these, the PPI for new nonresidential building construction, by asking a fixed group of contractors each month what they would charge to erect the same set of buildings. The buildings are a mix of office, warehouse, school, industrial (manufacturing) and health care structures. (There are separate indexes for each building type.) The actual index value is arbitrary; the significance of the index is its change over a given period.
This index increased at an annual rate of only 1 percent or so throughout 2016 and the first half of 2017. In July 2017, the index jumped 3.3 percent from a year earlier. The year-over-year change continued to accelerate until it hit a peak of 5.3 percent in November and December 2018, before subsiding slightly to a 5.1-percent change for the year ending in February 2019.
On a monthly basis, the PPI for new nonresidential buildings dipped 0.1 percent from January to February, its first decline since December 2016. Will this moderation last?
Contractors are Key
To get a glimpse of where bid prices may be headed, it is useful to look at contractors’ costs. That’s where the other BLS series are helpful.
The PPI for inputs to construction accelerated even more than the index for new buildings, climaxing in a 7.9-percent year-over-year increase between July 2017 and July 2018. Since then, the year-over-year change has cooled to a 2.4-percent rate as of February.
The outsized gains in the first half of 2018 reflected the imposition of tariffs on lumber, steel and aluminum, as well as sharp increases in the price of trucking services, petroleum products and gypsum products (mainly wallboard). The increases would have been even steeper if copper prices had not been plunging at the same time, reducing the cost of wiring, pipes and brass fixtures.
Prices leveled off once the market adjusted to the tariffs, while oil prices dropped sharply in late 2018. However, in the past few months, prices have climbed for petroleum products, copper, aluminum mill shapes, architectural coatings (paints) and insulation materials. Recent declines in gypsum and concrete products may reflect the slump in single-family homebuilding and will turn around if home construction picks up, as many analysts predict.
As for direct labor costs, average hourly earnings in construction had been rising faster than in the overall private sector. Construction wages and salaries averaged 9 percent more than the all-industry average at the beginning of 2016. By late 2018, the gap had grown to nearly 11 percent.
Average hourly earnings in construction increased 3.8 percent from December 2017 to December 2018 before slackening to a 3.1-percent year-over-year pace in January and February 2019. As with the cost of purchased inputs, however, the recent tapering appears unlikely to last.
Labor Problems Continue
Contractors, even more than employers in other industries, appear to be having difficulty filling positions with experienced workers. The monthly Job Openings and Labor Turnover Survey from BLS reported that construction industry job openings at the end of February totaled 286,000, the highest total for that month since the series began in late 2000 and a 44-percent increase from the previous February. And a survey by the Associated General Contractors of America (AGC) found that 78 percent of the 1,300 responding firms had difficulty filling positions, with 68 percent saying they expect as much or more difficulty in 2019.
Meanwhile, the pool of unemployed jobseekers with recent construction experience has drastically shrunk. The unemployment rate for such workers in February was down to 6.2 percent, a decrease from 7.8 percent a year earlier and the lowest February rate in the 20-year history of that series. (Industry unemployment rates, unlike the “headline” rate, are not seasonally adjusted; thus, numbers for a given month should only be compared to the same month in other years, not across months.)
To meet these workforce challenges, contractors will either keep raising pay to attract workers from other industries or require more time to complete projects. Indeed, 37 percent of respondents to AGC’s survey said they were raising bid or contract prices to cover higher labor costs, and 18 percent said they were quoting longer completion times.
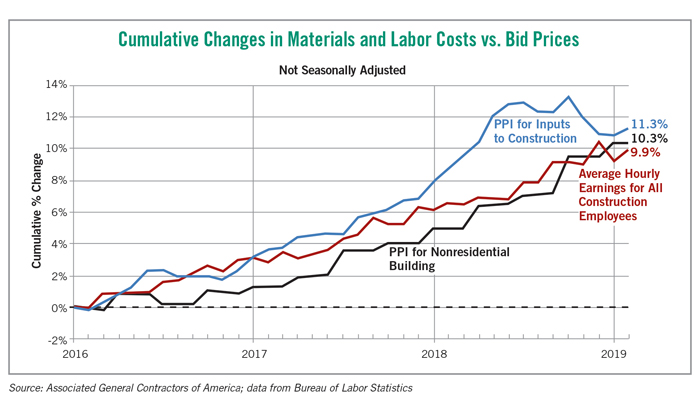
The chart above shows the cumulative increase since January 2016 in average hourly earnings in construction and the PPIs for new nonresidential buildings and for inputs to construction. Until very recently, contractors’ prices fell short of their costs for both labor and purchased inputs. Since late last year, the cumulative increase in bid prices has caught up with labor costs but not the cost of materials and services. If those costs reaccelerate, as currently appears likely, developers and investors should expect to see contractors’ prices pick up the pace as well.
Ken Simonson is the chief economist with the Associated General Contractors of America. He can be reached at ken.simonson@agc.org.

RELATED ARTICLES YOU MAY LIKE