
A More Relevant Measure of Risk

Is the cap rate to U.S. Treasury comparison an “apples-to-oranges” assessment?
THE SPREAD BETWEEN purchase cap rates and U.S. Treasurys (USTs) is a standard measure in commercial property forecasts as an indicator of the property market’s appreciation potential. It is argued that high spreads indicate there is room for cap rate compression and for property prices to appreciate, while low spreads carry the risk of widening cap rates and falling property prices.
The average spread between cap rates and USTs in 2016 was 2.75 percent, when NCREIF Property Index (NPI) data for commercial properties (office, industrial and retail) are compared to 10-year UST yields. Because the average spread over the past 25 years was 2.48 percent, the 2016 risk spread appears to be slightly above 25-year averages, suggesting a market that is slightly underpriced.
However, since 2016, 10-year UST securities are up 55 basis points (from the 2016 average to March 30, 2017), bringing the cap rate to UST spread below the 25-year spread average, signifying that commercial property prices may be a bit overvalued relative to the last 25 years. But what if this spread measure is wrong? Or, more accurately, what if the spread compares two very different risks?
Components of Investment Return
The 10-year UST is the base (risk-free) return for almost all long-term investments. Over the past 25 years, the 10-year UST yield averaged 4.5 percent with an embedded inflation premium of roughly 2.3 percent and a real rate of return of 2.2 percent. (See “Components of Property Investment Return” for a graphic presentation of investment returns.) The inflation premium is the return necessary to maintain the purchasing power of invested funds and the real rate of return is the investment return on the risk-free asset after adjusting for inflation.
The property risk premium needed to entice investors to invest in commercial properties is roughly 2 to 3 percent, depending on the creditworthiness of property tenants, cost of improvements and market profile. That is similar to the Moody’s Baa inflation-adjusted bond yield of 2.4 percent (over the past 25 years). A liquidity premium of 1 to 2 percent is needed to compensate investors for investing in assets that cannot easily or quickly be sold and turned into cash.
Combining the return components in this graph results in the property holding period return. Property holding period returns combine the property cash flow return and the property appreciation return. Property return components are similar to stock investment returns, where investors receive a dividend yield plus stock price appreciation. In general, however, property investments provide much higher cash flow return and lower appreciation than stocks.
In “Components of Property Investment Return,” embedded components of return are identified for USTs, which includes the inflation premium and real rate of return, and for cap rates, which includes the real rate of return and risk premiums. The real rate of return is common to both measures. However, the remaining portion of return on the 10-year UST is the inflation premium and on the cap rate it is the two risk premiums. So, in short, when one compares the spread between cap rates and USTs, the resulting measure is effectively comparing the inflation premium to the risk premium which, in economics, is an apples-to-oranges comparison.
A Different Measure of Risk
A more appropriate measure of relative risk compares property cap rates to long-term Baa bond rates after removing the inflation premium. Baa bond returns include an inflation premium, a real rate of return and a risk premium, where the risk premium provides a default risk premium over similarly termed USTs and is roughly akin to investing in commercial property. If the inflation premium is removed from Baa bonds, the resulting inflation-adjusted Baa bond yield provides a comparative metric to assess the reasonableness of property cap rates.
However, the property cap rate also includes a liquidity risk premium, which is not embedded in inflation-adjusted Baa bond rates, as bonds are relatively easy to sell/liquidate. In short, the cap rate-to-inflation-adjusted Baa bond yield comparison appropriately compares inflation-adjusted returns and risk premiums for commercial property with publicly traded bonds.
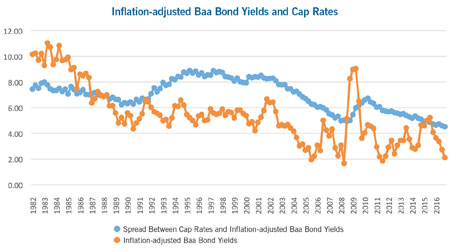
The blue line in the “Property Cap Rates and Inflation-Adjusted Baa Bond Yields” graph below represents the average implied cap rate for NPI commercial properties, revealing that property cap rates have largely ranged from 5.5 to 8.0 percent. In the third quarter of 2011, however, cap rates fell and have remained below 5.5 percent. The orange line is the yield on inflation-adjusted Baa bonds. This metric ranged from roughly 2 to 6 percent across the last 35 years, with significant volatility from 1982 to 1988 and again during the Great Recession.
In a normative investment environment, property cap rates should exceed inflation-adjusted Baa bond yields for two reasons: inflation-adjusted Baa rated bonds are likely to have a lower risk profile than the all-equity investment in the NPI property index, and Baa rated bonds can be liquidated more quickly than commercial property.
However, from 1982 to 1986, property cap rates provided a discount to inflation-adjusted Baa bond yields. This inversion indicates that property returns provided a negative liquidity and/or property risk premium to inflation-adjusted Baa bond yields, which suggests that commercial real estate was overpriced relative to inflation-adjusted Baa bond yields.
From 1987 to 1991, property cap rates were roughly at parity with inflation-adjusted Baa bond yields, providing little if any additional pricing premium for property investment risk and the illiquidity of commercial property investments relative to inflation-adjusted Baa bond yields. The periods from 1992 to 2007 and 2010 to 2016 maintained positive spreads to inflation-adjusted Baa bond yields. (Note that the 2015 spike in inflation-adjusted Baa bond yields was largely attributable to negative and near zero inflation caused by the dramatic fall in oil prices.) Finally, during the Great Recession, in 2008 and 2009, cap rates to inflation-adjusted Baa bond yields were again squeezed.
Factoring in Holding Period Returns
Additional analysis is needed to assess if the spread between cap rates and inflation-adjusted Baa bond yields may predict holding period returns. The “Inflation-adjusted Holding Period Returns for NPI Investments” table reveals the cap rate-to-inflation-adjusted Baa bond yields across time and the subsequent eight-, 10-, and 15-year property holding period returns, to assess whether the spread between cap rates and inflation-adjusted Baa bond yields at the time of property purchase informs ensuing holding period returns.
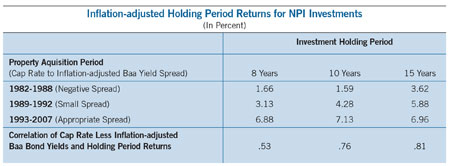
From 1982 to 1988, a time of negative cap rate-to-inflation-adjusted Baa bond yields, inflation-adjusted property holding period returns were a low 1.7 to 3.7 percent. During the low-spread years of 1989 to 1992, real holding period returns generally underwhelmed and were in the range of 3.2 to 5.9 percent. During the years 1993 to 2007, a time of strong positive spreads, holding period returns were consistently in the range of 6.9 to 7.1 percent.
Finally and importantly, the correlations between quarterly cap rates-to-inflation-adjusted Baa bond yield spreads and property holding period returns are a strong 76 to 81 percent for properties held for 10 to 15 years, indicating that this metric may provide strong predictive power.
In summary, there are two important takeaways. First, know what metric you are using and what it is measuring. Second, the spread between cap rates and inflation-adjusted Baa bond yields appears to be a very good comparative measure to assess whether current cap rates are becoming frothy or could provide value. Understanding this relationship and its application may be fortuitous for investors as the economy enters what might be a high-inflation period in the coming decades.

RELATED ARTICLES YOU MAY LIKE